Download
1 / 10
100 likes | 264 Views
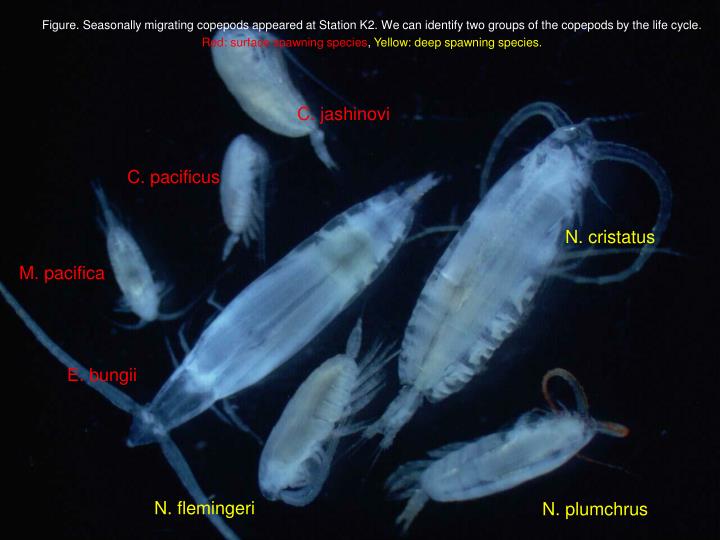
Figure. Seasonally migrating copepods appeared at Station K2. We can identify two groups of the copepods by the life cycle. Red: surface spawning species , Yellow: deep spawning species. C. jashinovi. C. pacificus. N. cristatus. M. pacifica. E. bungii. N. flemingeri. N. plumchrus.

E N D
Figure. Seasonally migrating copepods appeared at Station K2. We can identify two groups of the copepods by the life cycle. Red: surface spawning species,Yellow: deep spawning species. C. jashinovi C. pacificus N. cristatus M. pacifica E. bungii N. flemingeri N. plumchrus
Depth distribution of surface-spawning copepods Calanus pacificus concentrated their biomass above 50 m, and dominated by adult males and females. They would emerge dormancy and start reproductions. Depth (m) Eucalanus bungii showed two abundance peaks at surface and in mid-layers. Over the study period, they decreased younger specimens and they started a downward migration. Depth (m) Metridia pacifica was a strong diel migrator, residing at mid-layers in daytime and at the surface in nighttime. Thus, they are active. Depth (m) Figure 4. Depth distribution of the surface-spawning species in the layers above 1000 m collected by IONESS. Abundance is mean of four day-night deployments during the study period (n=4). Bars show standard error.
Depth distribution of deep-spawning copepods Younger specimens of Neocalanus cristatus appeared abundantly in the layers above 100 m and they were developing into overwintering stage toward the end of our study period. Depth (m) Overwintering stages were dominated Neocalanus flemingeri and they resided at the mesopelagic layers throughout the study period, showing dormancy. Depth (m) Neocalanus plumchrus was most predominant species among zooplankton community and concentrated overwintering stage at the surface. Depth (m) Figure 5. Depth distribution of the surface-spawning species in the layers above 1000 m collected by IONESS. Abundance is mean of four day-night deployments during the study period (n=4). Bars show standard error.
Table 1. Active carbon flux by the dominant diel migrants, Metridia pacifica and its comparison to POC flux. *Data from Ken. Parameter 1 Aug. 5 Aug. 12 Aug. 16 Aug. Migrant population Biomass (mgC m-2) 56.8 60.1 110.5 189.0 Abundance (102 animals m-2) 10.5 31.9 82.4 107.3 Weighted mean depth in daytime (m) 215.5 243.5 214.9 185.9 Ambient temperature in daytime (˚C) 3.2 3.2 3.3 3.3 Active carbon flux (mgC m-2 day-1) Respiration 1.0 1.3 2.6 4.1 Egestion 0.7 1.0 1.9 3.1 Mortality 0.3 0.3 0.6 0.9 Total 2.0 2.5 5.0 8.2 POC flux (mgC m-2 day-1)* 62.4 - 22.8 - Ratio of active carbon flux to POC flux (%) 3.2 - 21.9 - Active carbon flux by Metridia pacifica is estimated to be 2-8 mgC m-2 day-1. Respiratory and egestion fluxes showed a similarly importance, and mortality flux was minor component. These active carbon flux by the single species was accounted for more than 20% of sinking POC flux.
Table 2. Respiratory flux (mgC m-2 day-1) by the diel vertical migrants in the world’s oceans modified from Al-Murairi & Landry (2001). ME: Mesozooplankton, MA: Macrozooplankton, MP: M. pacifica. PC: Particulate carbon flux. Location Migrant biomass Flux Compared to PC Source (mgC m-2) Component (%) Depth (m) Atlantic NFLUX 29 ME+MA 2 3 150 Longhurst et al. (1990) BATS 192 ME 12 30 150 Dam et al. (1995) BATS 49 ME+MA 1 5 150 Steinberg et al. (2000) Pacific E. Equator 96 ME 3 15 150 Zang & Dam (1997) E. Equator 155 ME 6 20 150 Zang & Dam (1997) E. Equator 53 ME+MA 6 4 150 Le Borgne & Rodier (1997) W. Equator 47 ME+MA 3 6 150 Le Borgne & Rodier (1997) ALOHA 158 ME+MA 4 15 150 Al-Murairi & Landry (2001) ALOHA - ME+MA 1-5 7-29 150 Steinberg et al. (in prep.) K2 - ME+MA 10-29 16-127 150 Steinberg et al. (in prep.) K2 57-189 MP 1-4 2-3 150 Kobari et al. (in prep.) Comparing with the results of the world’s oceans, respiratory flux of K2 zooplankton community showed the largest numbers and was nearly equal to sedimentary flux in the NW Pacific as shown by Debbie. Although Metridia pacifica was dominant diel migrants, they were accounted for 10% of the zooplankton respiratory flux. Therefore other zooplankton taxa would more important for respiratory flux.
Table 4. Active carbon flux (mgC m-2 year-1) by the ontogenetic vertical migrants in the world’s oceans. CF: C. finmarchicus, NT: N. tonsus, NC: N. cristatus, NF: N. flemingeri, NP: N. plumchrus, Note: carbon flux at station K2 is shown as daily basis (mgC m-2 day-1). Location Migrant biomass Flux Compared to PC Source (mgC m-2) Spp. (%) Depth (m) Atlantic Ocean OWS I 346 CF 275 <1 200 Longhurst & Williams (1992) Southern Ocean ST - NT 3400 262 1000 Bradford-Grieve et al. (2001) STF - NT 9300 - - Bradford-Grieve et al. (2001) SAT - 1700 340 1000 Bradford-Grieve et al. (2001) NT Pacific Ocean OWS P - NC+NF+NP 5000 185 1000 Bradford-Grieve et al. (2001) Oyashio 7300 NC+NF+NP 4300 91 1000 Kobari et al. (2003) K2 322 NF 3* 9-20 500 Kobari et al. (in prep.) K2 1757 NC+NP ? - - Kobari et al. (in prep.) Active carbon flux by ontogenetic migration of N. flemingeri was estimated to be 3 mgC m-2 day-1 and was accounted for 20% of sinking POC at 500 m. Unfortunately, the active carbon flux by other two Neocalanus could not be estimated because they still resided at surface and were active. If it depends on migrant biomass, other two Neocalanus species will produce much larger carbon flux than those by N. flemingeri. This flux could not be negligible and significant carbon pathway to the mesoplagic.
Table 1. Community feeding rates and faecal pellets production by the ontogenetically migrating copepods in the layer above 150 m. *Data from Phil, **Data from Ken. Parameter Source 1 Aug. 5 Aug. 12 Aug. 16 Aug. Primary production (PP)* 590.1 427.5 300.3 355.2 Ratio of PP Pico 48.2 47.8 56.8 59.9 Nano 17.7 22.8 21.7 22.5 Micro 34.1 29.4 21.5 17.6 Biomass 2427.1 1246.3 1267.3 1319.5 Respiratory requirement 86.3 48.9 49.4 52.8 Feeding rate 215.7 122.1 123.5 131.9 Ratio grazed Phytoplankton 2.4 2.5 2.7 3.4 Other POC 97.6 97.5 97.3 96.6 Faecal pellet production 64.7 36.6 37.0 39.6 Units are mgC m-2 d-1, excepted for copepod biomass (mgC m-2) and ratio (%). Picophytoplankton unedible for the copepods dominated primary production. We measured pigment concentrations in copepod guts and estimated feeding rate and its composition. Phytoplankton composed <3% of the ingested carbon and their carbon demands should be relied on POC other than phytoplankton. Thus, their faecal pellets are also considered to come from non-phytoplankton materials. These results suggest that some fraction of the exported carbon could be channeled through microbial food web and the copepod community.
Contribution of the copepod faecal pellets to sinking POC Figure 6. Sinking POC flux and faecal pellet production (FPP) by the ontogenetic migrating copepods. POC flux at each layer was estimated from the formula of Pace et al. (1987) and primary production (Data from Phil). Since they were actively feeding on non-phytoplankton materials and transform them into faecal pellets, this process is considered to be an important carbon pathway during seasons dominated by small phytoplankton. Comparing with sinking POC flux estimated from the equation of Pace and others, the copepod community feces composed less than 10% of sinking POC above 150 m, and their contribution to sinking POC is considered to be small.
What we knew from the ontogenetic migrants? 1. Most of the copepod community resided at surface during our study period and was developing with actively feeding on non-phytoplankton. 2. Carbon budget of the copepod feeding and egestion shows that a large fraction of their ingested carbon is channeled through microbial food web but their faecal pellets are minor component of sinking POC. 3. Active carbon flux by dominant diel migrant composed more than 20% of the sedimentary POC flux at 150 m and can be supplement source for the mesopelagic carbon demand. 4. Active carbon flux by ontogenetic migration of single species was account for 20% of the sedimentary POC flux at 500 m, and could be an important source for the mesopelagic carbon demand considering with the copepods residing at surface.