Download
1 / 28
280 likes | 401 Views
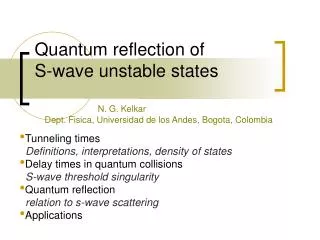
A mechanistic model study of quasi-stationary wave reflection. D.A. Ortland T.J. Dunkerton ortland@nwra.com NorthWest Research Associates Bellevue WA. Quasi-stationary flow. Describe in terms of zonal mean and wave components;

E N D
A mechanistic model study of quasi-stationary wave reflection D.A. Ortland T.J. Dunkerton ortland@nwra.com NorthWest Research Associates Bellevue WA
Quasi-stationary flow • Describe in terms of zonal mean and wave components; • Mainly interested in the atmospheric response to stationary (or slowly varying) non-symmetric forcing; • Even if the forcing is stationary, the response may not be: non-linear interaction between the waves and mean flow can cause vacillation; • Quasi-stationary flow provides a ‘background’ for baroclinic eddies, and these eddies, in turn, provide source terms that drive the mean flow and stationary eddies (zonal index dynamics); • Begin by separating out the influence of baroclinic eddies by using a zonally truncated model (quasi-linear=mean+wave 1).
Can changes in the stratospheric flow influence the state of the stationary waves and mean flow in the troposphere? • Solutions to both wave and mean flow equations depend non-locally on conditions throughout the domain and at the boundaries. Non-local properties to solutions of the general 2-D wave equation are not well understood. • Think in terms of a 1-D problem: The stratosphere acts like a variable upper boundary condition on the stationary wave solution in the troposphere. With a wave source in the troposphere or at the surface and radiation conditions imposed above the stratosphere, the solution to the wave condition can be solely described in terms of an upward propagating wave, provided that the square of the refractive index is positive throughout the domain and changes ‘slowly’. • When this is not the case, a downward propagating component must also be included in the solution. How large this component is depends in the details of the structure of shears and the region of negative refractive index (turning points, critical layers, overreflection, tunneling, etc.)
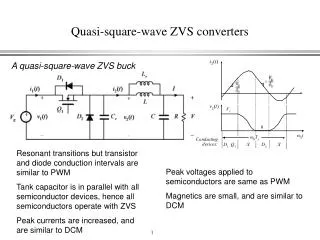
Model description • A quasi-linear primitive equation sigma-coordinate model is used to study the fundamental interaction between the mean flow and a disturbance with zonal wave-1 propagating in two dimensions on the sphere. • A constant wave-1 vorticity source, intended to simulate the stationary component of tropospheric baroclinic eddy forcing, is centered over 60°N at 12.5 km. • 36 layers from 0-90 km; 40 Legendre polynomial horizontal resolution; Sponge layer above 60 km relaxes to steady-state zonally symmetric flow determined from an independent zonally symmetric run; • Perpetual January conditions are maintained through Newtonian relaxation to radiative equilibrium temperatures and an imposed constant momentum force (crude representation of GW drag). • Without waves, CIRA climatology is reproduced. The time-mean with waves present has a weaker jet. • Forcing level used for this experiment produced a periodic vacillation cycle with two warmings per cycle.
Model evolution in the Stratosphere • The next few slides show the basic evolution of the vacillation cycle in the stratosphere. The periodic cycle consists of two warmings, with the return of a strong vortex after the second warming. The warming/recovery cycle appears to be determined by the rate at which the subtropical jet in the upper stratosphere decays, thereby refracting or reflecting waves toward the pole. • The vacillation in the model is primarily stratospheric in origin, but the troposphere vacillates as well. The troposphere does not vacillate due to its own internal dynamics, but rather responds to changes in the wave field structure that results from changes in the stratospheric mean flow.
Zonal mean winds and EP Flux cross sectionmid-latitude critical forms prior to first warming inside region of qy<0(preconditioning without wave breaking) Quasi-linear run Force level=1.75e-5
EP flux redirected toward poleMean flow decelerates to form large region with qy<0 and u<0
Polar winds recover somewhat between warmings as EP flux redirected equatorward. A region of reversed PV gradient remains in the polar upper stratosphere, however. This region appears to have an effect on the wave structure all the way into the troposphere, as will be seen later.
The second warming has stronger easterliesWind reversal descends below 30 km
Waves appear to be over-reflected (Lindzen and Tung, 1978): note EP flux is directed downwards from a region with qy<0 and u<0. Mean polar stratosphere winds rapidly accelerate as a result of wave activity exiting this region.
Both momentum and heat flux anomalies act to accelerate flow anomalies in the troposphereThe U response to either heat or momentum flux anomalies alone are roughly in phase. The response to heat flux anomaly is somewhat larger Period=57 d Equatorward Mom flux dFz/dz<0 Equatorward heat flux
Additional Experiments • By solving the mean-flow equations alone, we can determine that only flux anomalies below 15km or so significantly affect the troposphere mean winds. Since the wave structure is determined by the mean flow, we seek to find out how much the troposphere and stratosphere mean wind variations contribute to the wave flux anomalies. • Time-dependent linear model – fix mean winds above (below) some altitude at the time-mean state of the control run and vary the winds below (above) exactly as in the control run. Solve the linear wave equation for the corresponding time-dependent mean flow. • Results show that heat flux (Fz) anomalies near the tropopause largely arise from stratospheric wind variations, while momentum flux (Fy) anomalies arise from wind variations in the troposphere.
Fz anomaly at the tropopause for 4 experiment configurations Control run Ubar>25km varies Ubar<25km varies Ubar<12km varies
Effect of the zonal wind on wave 1 geopotential height in the troposphere:Wave amplitude varies considerably as a result of changes in the stratosphere winds alone (the wave source is held fixed). Mean wind variations in the troposphere alone has little effect on the wave amplitude. This suggests that resonance plays a role, another way of saying that a downward reflected wave is present.
Reflection coefficient • diagnostic for determining the reflected wave component at each point in the meridional plane; • Modeled after standard definition of R for 1-D wave propagation (e.g. Eliassen and Palm, 1960):
Reflection coefficient • Measures how much the wave deviates from a stationary plane-wave solution. This deviation may happen due to: • Reflection; • Non-WKB conditions; • Superposition of monochromatic wave responses to multiple source regions; • Breakdown of the quasi-geostrophic approximation; • Wave source at the point of interest; • Transience.
Perturbation geopotential structureW1 & W2 mark occurrence of the two warmings Polar region of qy<0 confines wave to lower stratosphere W1 W2 Wave phase variations reflect Fz variations all the way down to the tropopause Overreflection marked by reversal of vertical phase gradient Reflection coefficient increases when turning point is present Green contour marks qy=0
T40 experiments • Does a stratospheric warming have a significant effect on the evolution of synoptic scale eddies? • Add zonal resolution to the model and allow baroclinic eddies to develop. • A control run has the identical configuration to the quasi-linear run except for the addition of zonal components. • Two additional runs employ a sponge layer with lower boundary either at 40km or 25 km. The first inhibits the development of a warming, the second essentially inhibits all stratospheric variability. The sponge relaxes the wave to zero amplitude and the mean flow to the initial condition. This causes the stratosphere to be a wave sink and inhibits any changes to the zonal mean circulation. Thus, differences in the troposphere between experiments can be attributed to effects that the stratospheric state has on the eddy structure in the troposphere.
Mean flow evolution at 58NSynoptic scale eddies form in the T40 run. These cause the tropospheric mean winds evolve differently from the quasi-linear run. The baroclinic eddy/mean flow interaction appears to be affected by events in the stratosphere Addition of zonal resolution causes the warming to evolve differently from the quasi-linear run T40 run Quasi-linear run m/s Warming is inhibited High strato sponge Warming is prevented Low strato sponge
Mean flow evolution in the troposphereonset of synoptic scale eddies cause an initial deceleration of the polar mean flow and a subsequent bifurcation of the tropospheric jet. T40 run Quasi-linear run m/s These last two panels show that the tropospheric evolution is somehow changed by preventing the stratospheric warming High strato sponge Low strato sponge
Effect of stratosphere on troposphere mean flowU(strato sponge)-U(control)These panels show that the difference between the strato sponge runs and the control run is little affected by moving the sponge down. This suggests that the warming in the upper stratosphere, and not the small wind variations in the lower stratosphere, has the most effect on the troposphere dynamics. The differences in mean flow evolution are driven by the Fz anomalies shown in the next figures.
Evolution of wave 1 FzA large increase in upward wave flux at day 35 is caused by the onset of the synoptic scale eddies and contributes to the stratospheric warming. A downward pulse poleward of 70N is evident after day 40. This downward pulse is not present in the sponge runs (see the positive anomaly in the second and third panels). The last two panels show Fz differences. The positive anomaly indicates wave reflection is inhibited in the sponge runs These anomalies are probably caused by differences in the refractive index of the lower stratosphere between the lstrat and control runs
Effect of the stratosphere on the transient wave momentum flux.One hypothesis is that a mean flow anomaly, initiated by an Fz (heat flux) anomaly resulting from the propagation characteristics of the stratosphere is maintained by synoptic Fy (momentum flux) anomalies.(anomaly=deviation from the control run)
Reflection coefficient at 60NThe reflection coefficient for the strat sponge run indicates that inhibiting the warming prevents wave reflection. The sponge in the lstrat run also absorbs wave activity and thereby reduces wave reflection as well. Quasi-linear T40 control Upper strat sponge Lower strat sponge
Met Office Assimilated DataThe next three panels show evidence for reflection in real data Altitude
EP Cross section and zonal mean winds This example shows downward EP flux all the way to the tropopause after a major warming Altitude Contour interval=10m/s Negative values dashed Latitude
Example of reflection not associated with a warming. EP flux shows primarily the wave 1 component, which is reflected from the strong jet, but some wave 2 generated in situ and is also propagating downward. A strong jet implies small refractive index in the stratosphere. Waves are diverted up the gradient of the refractive index back toward the troposphere. Altitude Latitude
Conclusions • Model simulations show that wave reflection can occur in conjunction with stratospheric warmings. • Reflection is likely to occur from other mean-wind configurations as well (e.g. a strong vortex) , but a downward wave component may be enhanced by an over-reflecting critical level that appears to occur in conjunction with major warmings. • The reflected wave causes heat-flux anomalies that force small mean-flow anomalies in the troposphere. The tropospheric mean-flow and/or wave anomalies, in turn, appear to affect the evolution of the synoptic-scale eddies, which may then enhance the anomalies through positive feedback mechanisms (e.g. Robinson 1996, 2000). • Disturbed, weak stratospheric vortex winters may therefore have more significant downward-reflected waves, causing negative Fz anomalies near the high-latitude tropopause, and hence a weaker tropospheric vortex. • Our point of view is that the main stratospheric influence on the troposphere is through changes in the waveguide of the stationary waves. Changes aloft are communicated to the troposphere through wave reflection.