Download
1 / 67
670 likes | 786 Views
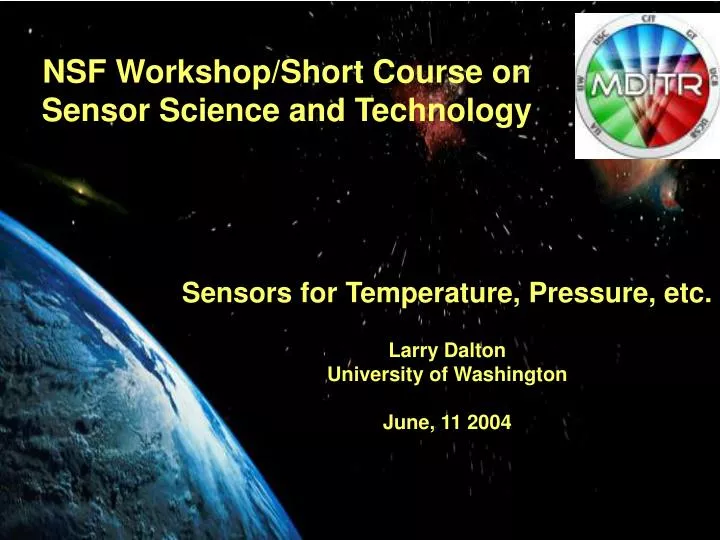
NSF Workshop/Short Course on Sensor Science and Technology. Sensors for Temperature, Pressure, etc. Larry Dalton University of Washington June, 11 2004. Sensor Paints. Optimization of individual properties and multi-sensor paints • Pressure sensing paints (PSPs)

E N D
NSF Workshop/Short Course on Sensor Science and Technology Sensors for Temperature, Pressure, etc. Larry Dalton University of Washington June, 11 2004
Sensor Paints Optimization of individual properties and multi-sensor paints •Pressure sensing paints (PSPs) --Critical commercial application to wind tunnel testing (planes, cars/trucks, etc.—Boeing, Lockheed Martin, Ford, General Motors) --Embedded network sensing including infrastructure sensing --Biocompatible coatings (study of insect flight) --Studies of fluid dynamics --Optimization of all properties (photostability, temperature insensitivity, etc.) •Temperature sensing paints (TSP) --Can be used with PSPs to achieve more accurate wind tunnel measurements •Shear sensing paints (SSP)—Two approaches
Sensor Paints: New Directions Infrastructure Monitoring (Smart worms—optical fibers) •Oxygen •Moisture •pH •Corrosion (various ions) •Stress/Strain NIR Detection Leak Detection Smart Clothing
Sensing Materials PSP • Used in the development of aircraft and other vehicles • Replaces older pressure tap technology • Phosphorescent dye dissolved in oxygen permeable polymer • Cheaper to use and gives continuous information
Coating on substrate O2 O2 PSP Layer Dye O2 O2 O2 O2 O2 1O2 Base coat Substrate (wing)
Pressure Sensitive Paint • Theory • Luminescence of certain organometallic molecules (luminophors) are quenched by oxygen gas • Combining these molecules with a polymer matrix results in PSP • Advantages • Measures pressure distributions over a surface area • Allows real time modelling • Allows surface flow visualization • Disadvantages • PSP has temperature dependency • Non-linear response to pressure • Reduced sensitivity at low speed testing
Dual Luminophor-based PSP • Dual luminophor-based PSP incorporates two luminophors in the same polymer matrix • Luminophor 1: Pressure independent emission • Intensity reference; temperature sensor • Luminophor 2: Pressure dependent emission • Pressure sensor • Use of a dual luminophor system has advantages • Wind-off measurement is eliminated • Temperature dependency is reduced • Corrects excitation variations
Requirements of a Dual Luminophor System • Both luminophors must be excited by a single, pulsed excitation source • Well separated emission spectra • Low temperature dependency • Comparable photostabilities
University of Washington’s Dual Luminophor PSP • Luminophor 1 (Intensity reference): • Platinum tetra-fluorophenylporpholactone (PtTFPL): exc 390 nm, det 740 nm • Luminophor 2 (Pressure sensor): • Magnesium tetra-hexafluorophenylporphryn (MgTFPP): exc 390 nm, det 650 nm
0% O2 5% O2 10% O2 15% O2 20% O2 25% O2 30% O2 100% O2 Relative Intensity 550 600 650 700 750 800 850 900 Wavelength (nm) Dual Luminophor: Pressure Sensitivity Measurements MgTFPP PtTFPL 0% O2 100% O2 Khalil, Journal of Porphyrin and Phathalocyanines, 6, 135, (2002) Zelelow, Sensors and Actuators, B 96, 304, (2003) Khalil, Sensors and Actuators, B, 97, 13-21, (2004)
MgTFPP only PtTFPL only Dual Luminophor Dual Luminophor: Photodegradation
20 16 12 IPtTFPL/IMgTFPP 8 4 0 0 20 40 60 80 100 % Oxygen Dual Luminophor: Ratiometric Intensity Response
Dual Luminophor: Comparison to Single Luminophor PSP Single Luminophor PSP Pref = 1 bar; Tref = 15° C MgTFPP/PtTFPL PSP Pref = 1 bar; Tref = 15° C ST=+0.05% per °C SP=65% per bar ST=-0.18% per °C SP=68% per bar
Temperature Sensitivity Correction PSPcorr = I1 (k/I2 +1-k)
Develop a new approach to measure 2-D surface pressure by monitoring the 1270 nm singlet oxygen emission Singlet Oxygen Project Objective Motivation • Availability of NIR InGaAs Camera • Many known efficient photosensitizers for singlet oxygen • NIR detection allows for multiple sensor configurations
Energy Diagram Excitation Source Radiationless Decay Bimolecular Quenching Molecular Emission 634 nm kq 1270 nm Porphyrin Oxygen kexc k1 kp k2 ko kO2
Simulation of Singlet Oxygen Production Kexc=2000 s-1 kp=1.66e4 s-1 kq=1e8 s-1M-1 ko=.01 s-1 ko2=.67 s-1M-1 k1=0 s-1 k2=10000 s-1 [O2]=0.1 mM [Porphyrin]=0.01 mM τ(1g) = 1 ms τ(1g) = 0.1 ms
Singlet Oxygen on Film Surface 21% Oxygen ~ 1 % Oxygen
Low Speed Automotive Test Objectives • Performance evaluation of dual luminophor PSP at low airflow velocities • Dual luminophor PSP was applied to a model automobile and subject to low speed wind tunnel tests • Points of evaluation: • Temperature sensitivity correction • Model motion • Excitation variations
Raw Pressure and Temperature Data Airflow velocity: V = 94 m/s
Corrected Cp Data Airflow velocity: V = 94 m/s
Measured Temperature -20° 0° 20° T (°C)
Low Speed Automotive Test Summary • The ratio of the two signals (PSP/TSP) • Simplicity, no need to compute local temperature • Correct for excitation variations • Reduced the temperature sensitivity to -0.07% / C • Minimum effect on the pressure sensitivity. • PSPcorr algorithm and simple PSP/TSP ratio produced similar results.
Insect Flight: Anticipated Difficulties • Response Time • Wing beat frequency = 200 Hz • Resolve into 10 positions 2000 Hz • 1/2000 Hz 0.5 ms response time desired • Sensitivity • The minimum lift pressure required by a honey bee in hovering flight is ~ 210-4 atm • Existing PSPs were to stiff, heavy, and slow for insect flight applications P = 510-1 atm • P = 210-4 atm
Visualizing the von Karman Street Vortex with PSP • von Karman Street vortex shedding occurs around a cylinder • During the wing beat cycle an insect generate vortices to create lift • DPbee = 0.0001 atm, f = 150 Hz DPcylinder = 0.001 atm, f = 100 Hz http://socrates.berkeley.edu/~flymanmd/ • Simulate insect flight by mapping the surface pressure of a cylinder
Insect Flight Studies Continuous Pressure Map • Both wing pairs coated with PSP • 400 nm laser for excitation and a CMOS video device for detection - Laser pulse and camera shutter phase-locked to the wing beat frequency • Images will be obtained at different points in the wing beat cycle • Pressure map used to study lift as a function of wing position Camera Laser Microphone Tethered bee
Progress in Pressure Sensitive Paint at University of Washington
Shear Stress • One of the two fundamental forces measured by aerodynamicists. • Pressure: force normal to airfoil surface, P • Shear Stress: force tangent to airfoil surface, τw Surface Pressure, P Measured by PSP Shear Stress, τwMeasured by SSP airflow, v airfoil
Mechanical balances Preston Tubes Hot wire and hot-film anemometry MEMS sensors But these techniques are still point measurements. The resolution of data is dependent upon the number of sensors employed. Current Shear Stress Measurement Techniques Naughton, J., Sheplak, M., Progress in Aerospace Sciences, 38, pp. 515-570 (2002)
SSP Project Objective • To develop a shear sensitive paint that will provide high-resolution, 2-dimensional shear stress measurements over dynamic surfaces. • Integrate this technology with current pressure and temperature sensitive paints, ultimately creating a single tool that will measure both pressure and shear stress.
SSP Project Approaches • Method 1: • Temperature sensitive paint (TSP)-based shear sensitive paint • Method 2: • Dynamic birefringence-based SSP
Method 1: TSP-based SSP • Theory: • Shear stress can be calculated from the following, τw= 2cf ρu2 cf = coefficient of friction, a constant that can be derived from the Reynold’s number ρ = density of the airflow u = velocity of airflow at a given point on the surface of the airfoil
Steady State Experiment C Wall Jet Wall Jet 15 psi (~400 m/s, Re = 2.0x10⁵) 3 psi (~180 m/s, Re = 8.6x10⁴) Khalil, Rev. Sci Instrum., 75, pp. 192-206 (2004).
Calibration of TSP Temperature Response • 5 pixel wide linescan at x = 70 (white line) • Standard deviations better than 0.7%
Calibrated TSP Temperature Response • 5-pixel wide linescan at x=70. • Note prominent stagnation point at higher pressures.
Consider an airfoil that is heated to a given temperature with a thermal pulse of energy. The rate of cooling over a given point on the surface of the airfoil will be a function of the velocity of airflow, u, above it. TSP-based SSP Theory, cont.
TSP-based SSP Theory, cont. Temperature Profile of a Thermally Pulsed Airfoil Under Varying Airflow Velocities Time
Experiment Parameters • TSP: 1:200 EuTTA:FIB, 7.5% FIB in TFT • Test surface: steel ribbon (0.5 cm x 2 cm) • Compressed air is directed over the test surface using a 26-gauge needle. • Airflow is varies from 3 to 7 psig (~180 m/s – 400 m/s, Re = 8.6 x 10⁴ to 2.0 x 10⁵) • The ribbon is heated by application of a direct current. • Final temperature varies between 29 and 31 C • Data acquisition begins when direct current is switched off. • A series of 10 images are acquired at an exposure time of 100 ms.