Download
1 / 12
120 likes | 234 Views
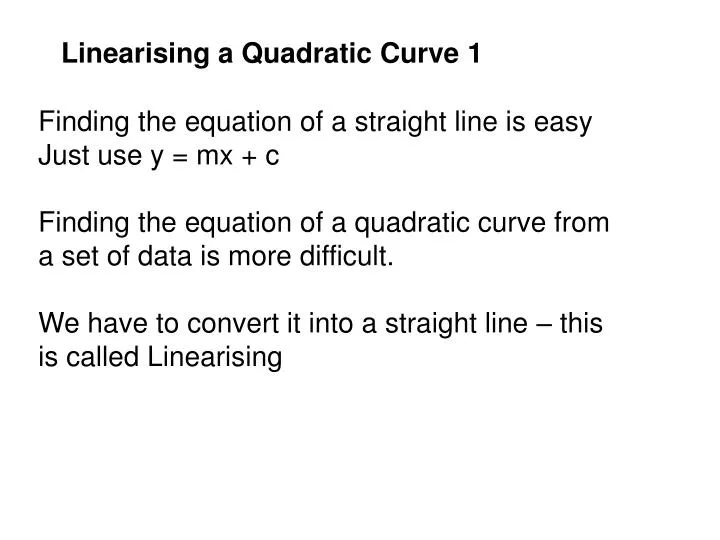
Linearising a Quadratic Curve 1. Finding the equation of a straight line is easy Just use y = mx + c Finding the equation of a quadratic curve from a set of data is more difficult. We have to convert it into a straight line – this is called Linearising. Graph of distance against time. 14.

E N D
Linearising a Quadratic Curve 1 Finding the equation of a straight line is easy Just use y = mx + c Finding the equation of a quadratic curve from a set of data is more difficult. We have to convert it into a straight line – this is called Linearising
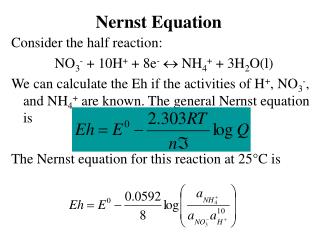
Graph of distance against time 14 12 10 8 Distance 6 4 2 0 0 0.2 0.4 0.6 0.8 1 1.2 -2 time Linearising a Quadratic Curve 1
Graph of distance against time Distance Using your knowledge of completing the square the equation is y = a(x + b)2 + c a = vertical stretch b = horizontal translation c = vertical translation 14 12 10 8 6 4 2 0 0 0.2 0.4 0.6 0.8 1 1.2 -2 time In our case b = 0 No Horizontal translation So y = ax2 + c
To find a and c make a new table of values of x2where x2 = X So y = aX + c
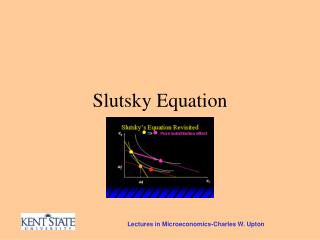
Graph of distance against time2 y = 12.812 X - 0.3852 14 12 10 8 6 distance y 4 2 X 0 0 0.5 1 1.5 -2 Now a straight line is obtained The gradient is m =12.812 The y intercept is c = –0.3852 The equation is y = 12.812X – 0.3852 Replace X by x2y = 12.812x2 – 0.3852 So distance = 12.812time2 – 0.3852
Finding the equation of a quadratic curve 2 Graph of No. of cold cases against no. of days 120 100 80 60 No. ofcases 40 20 days 0 0 5 10 15 20 25 -20 -40 Plot the points and workout the horizontal translation of the maximum
Graph of No. of cold cases against no. of days 120 100 80 60 No. ofcases 40 20 days 0 0 5 10 15 20 25 -20 -40 The horizontal translation is x = 10 as the maximum occurs at x = 10 It has also been flipped, stretched vertically and translated vertically Using your knowledge of completing the square The equation is y = a(x + b)2 + c a = vertical stretch b = horizontal translation c = vertical translation
In our case b = –10 as it has been translated 10 to the right y = a(x - 10)2 + c To find a and c make a new table of values of (x–10)2 So y = aX + c where X = (x–10)2
Now plot a new graph of X = (x–10)2 and y = No. of cases Find the equation of the line of best fit Do this by hand, Excel and the calculator to provide the required checks
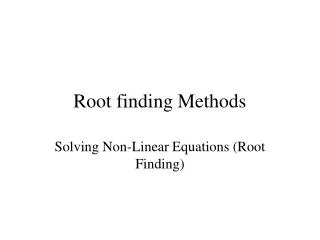
Graph of No. of cold cases against (x-10)2 y = -0.8447x + 96.577 120 100 80 no. cold cases 60 40 20 (x-10)2 0 0 50 100 150 200 -20 -40 Now a straight line is obtained The gradient is m = –0.8447 The y intercept is c = 96.577
The equation is y = –0.8447X + 96.577 Replace X by (x – 10)2 y = –0.8447(x – 10)2 + 96.577 Multiply out the brackets y = –0.8447(x – 10)(x – 10) + 96.577 y = –0.8447(x2 – 20x + 100) + 96.577 y = –0.8447x2 + 16.894x – 84.77 + 96.577 y = –0.8447x2 + 16.894x + 11.807
No. of cases = –0.8447No. of days2 + 16.894No. of days + 11.807 This is very similar to the quadratic curve of best fit in the original graph This equation can be used to work out the no. of cases if you are given the no. of days Eg If days =10 then No. cases = –0.8447102 + 16.89410 + 11.807 = 96.27 Actual value = 105 % error =