Download
1 / 9
90 likes | 238 Views
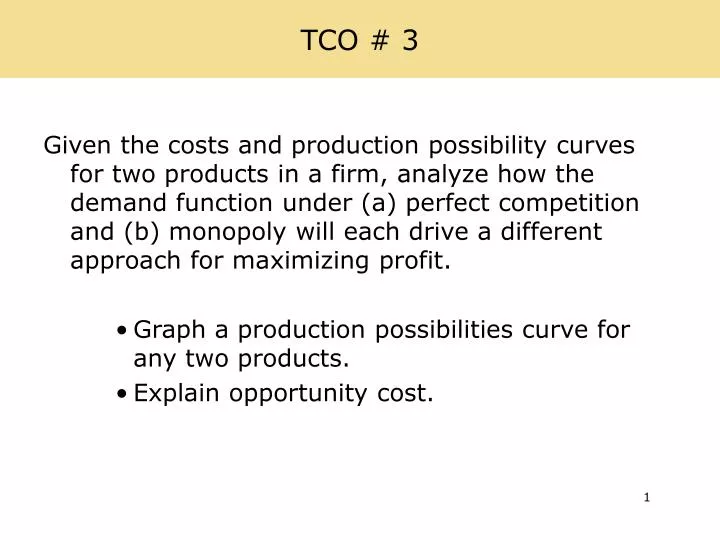
TCO # 3. Given the costs and production possibility curves for two products in a firm, analyze how the demand function under (a) perfect competition and (b) monopoly will each drive a different approach for maximizing profit. Graph a production possibilities curve for any two products.

E N D
TCO # 3 Given the costs and production possibility curves for two products in a firm, analyze how the demand function under (a) perfect competition and (b) monopoly will each drive a different approach for maximizing profit. Graph a production possibilities curve for any two products. Explain opportunity cost.
What we’re going to do We are going to learn about graphing a Production Possibilities Curve. We start with where the graph will be located: positive quadrant and the learn the model and then graph it.
Production Possibilities Purpose: determine how much can be produced with what you have and what are the opportunity costs of changing production. Criteria: Full employment of all resources all the time Time is constant—this is a snapshot not a movie Resources limited to what you have RIGHT NOW Technology can NOT be changed Two goods/services or categories of these.
The Production Possibilities Curve Below is the PPC for Bread and/or Rolls What resources are being used? Why can’t we have 4 loaves of bread and 1 batch of rolls?
What PPC tells us How many goods can be produced right now with the resources we have. If we produce all bread, how many can we have? How much it will cost us (opportunity cost) to produce more rolls in terms of foregone bread. If we are producing all bread, to get 1 batch of rolls means we must give up 1 loaf of bread. If we want more rolls, then we must give up 1 loaf of bread but we only get ½ a batch of rolls. This shows the Law of Increasing Costs due to the Law of Diminishing Marginal Productivity.
Applied to Whole Economy If we have full employment, we are ON the PPC. If we have unemployment, we are below it. To have economic growth (larger pie so we can all have more of it), we need to either acquire more of our limited resources, get better technology, or allow time to change. An easy way to increase economic growth potential for the future is to put more of our resources into the production of capital goods now. Remember that capital goods ARE one of the factors of production.
PPC and Economic Growth Below is the PPC for Bread and/or Rolls with economic growth By producing more capital goods we built more ovens, etc. for the future so we could produce more of each. New PPC
Apply this Apply this to your real life. Bring your examples to class. Home Work School Hint: The example I used on bread and rolls is a real one based on what I can do at home with my fixed and limited stock of capital goods, land resources, labor and entrepreneurship being used fully and within a period of time.