Download
1 / 1
10 likes | 70 Views
IDW. kriging. spline. 10 sq.miles-6 hour. 10 sq.miles-12 hour. Comparison using IDW. Predicted Errors Mean=0.0000589 Root Mean Square=0.00612. Comparison using Spline Predicted Errors Mean=-0.0000140 Root Mean Square=0.0055. Data Used Probable Maximum Precipitation Maps.

E N D
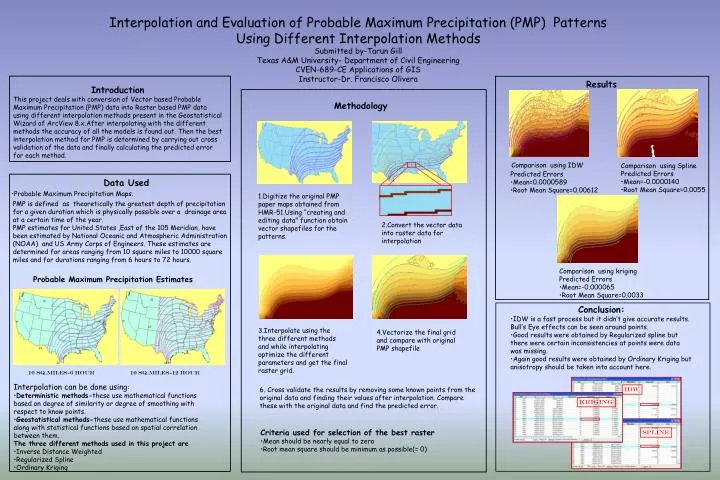
IDW kriging spline 10 sq.miles-6 hour 10 sq.miles-12 hour Comparison using IDW • Predicted Errors • Mean=0.0000589 • Root Mean Square=0.00612 • Comparison using Spline • Predicted Errors • Mean=-0.0000140 • Root Mean Square=0.0055 • Data Used • Probable Maximum Precipitation Maps. PMP is defined as theoretically the greatest depth of precipitation for a given duration which is physically possible over a drainage area at a certain time of the year. PMP estimates for United States ,East of the 105 Meridian, have been estimated by National Oceanic and Atmospheric Administration (NOAA) and US Army Corps of Engineers. These estimates are determined for areas ranging from 10 square miles to 10000 square miles and for durations ranging from 6 hours to 72 hours. • Comparison using kriging • Predicted Errors • Mean=-0.000065 • Root Mean Square=0.0033 Interpolation and Evaluation of Probable Maximum Precipitation (PMP) Patterns Using Different Interpolation Methods Submitted by-Tarun Gill Texas A&M University- Department of Civil Engineering CVEN-689-CE Applications of GIS Instructor-Dr. Francisco Olivera Results Introduction This project deals with conversion of Vector based Probable Maximum Precipitation (PMP) data into Raster based PMP data using different interpolation methods present in the Geostatistical Wizard of ArcView 8.x.After interpolating with the different methods the accuracy of all the models is found out. Then the best interpolation method for PMP is determined by carrying out cross validation of the data and finally calculating the predicted error for each method. Methodology 1.Digitize the original PMP paper maps obtained from HMR-51.Using “creating and editing data" function obtain vector shapefiles for the patterns. 2.Convert the vector data into raster data for interpolation Probable Maximum Precipitation Estimates 22 19 • Conclusion: • IDW is a fast process but it didn’t give accurate results. • Bull’s Eye effects can be seen around points. • Good results were obtained by Regularized spline but there were certain inconsistencies at points were data was missing. • Again good results were obtained by Ordinary Kriging but anisotropy should be taken into account here. 27 3.Interpolate using the three different methods and while interpolating optimize the different parameters and get the final raster grid. 4.Vectorize the final grid and compare with original PMP shapefile 24 32 38.7 • Interpolation can be done using: • Deterministic methods-these use mathematical functions based on degree of similarity or degree of smoothing with respect to know points. • Geostatistical methods-these use mathematical functions along with statistical functions based on spatial correlation between them. • The three different methods used in this project are • Inverse Distance Weighted • Regularized Spline • Ordinary Kriging 6. Cross validate the results by removing some known points from the original data and finding their values after interpolation. Compare these with the original data and find the predicted error. • Criteria used for selection of the best raster • Mean should be nearly equal to zero • Root mean square should be minimum as possible(= 0)