Download
1 / 23
230 likes | 315 Views
Journey to Work from 1990 Census and ACS National test (C2SS). Elaine Murakami, USDOT, FHWA Nanda Srinivasan, Cambridge Systematics Inc. Understanding the Surveys. 2000 ACS: Census 2000 Supplementary Survey (C2SS). Sample: 1 in 6 of all households. (15.32 million households)

E N D
Journey to Work from 1990 Census and ACS National test (C2SS) Elaine Murakami, USDOT, FHWA Nanda Srinivasan, Cambridge Systematics Inc.
Understanding the Surveys 2000 ACS: Census 2000 Supplementary Survey (C2SS) • Sample: 1 in 6 of all households. (15.32 million households) • Coverage: Whole country – 3140 counties • Point in time Survey • Reference period: April 1, 1990 • Group quarters’ population included 1990 Decennial Census • Sample: 700,000 households • Coverage: 1203 counties • Rolling Survey • Conducted over 12 months • Group quarters’ population NOT included
Understanding the Surveys • Mode to work: “usual last week” • Mode to work: allows only for ONE response • C2SS includes only workers in hhlds (does not include workers in Group Quarters) • 1990 CTPP tabulated travel time for all workers—households and group quarter information cannot be separated. 2000 ACS tabulated travel time only for workers in households.
Nationwide Comparison Change Change Variable 1990 2000 (Number) (%) Number of households 104,724,456 91,947,410 12,777,046 13.90 Total population in households 242,050,161 273,643,269 31,593,108 13.05 Total workers in households 113,437,877 127,437,475 13,999,598 12.34 Average travel 1 min 57 sec 22 min 23 sec 24 min 20 sec Time (min) 8.73 Percent of households with - 11.5% 9.3% -2.2% no vehicles
Mode to work • In 2000, 76.3 percent of workers reported driving alone to work. • In 2000, 11.2 percent of workers reported carpooling, followed by transit (5 percent), work at home (3.2 percent), and walk (2.7%). • Carpooling declined from 13.4 percent (1990) to 11.2 percent (2000) of all workers. • Transit retained 5 percent share between 1990 and 2000. • In numbers, workers using transit for their JTW increased 7.7 percent over the 10-year period (1990 to 2000).
Universe: Workers: All Workers 16 years and older living in households Data Source: 1990 Census Transportation Planning Package (CTPP)
Universe: Workers: All Workers 16 years and older living in households Data Source 2000 ACS: Census 2000 Supplementary Survey (C2SS)
Drive Alone to Work Change in Percent, 1990-2000 Legend Universe: Workers: All Workers 16 years and older living in households Data Sources: 2000 ACS: Census 2000 Supplementary Survey (C2SS) 1990 Census Transportation Planning Package (CTPP)
Carpool to Work Change in Percent, 1990-2000 Legend Data Sources: 2000 ACS: Census 2000 Supplementary Survey (C2SS) 1990 Census Transportation Planning Package (CTPP) Universe: Workers: All Workers 16 years and older living in households
Transit to Work Change in Percent, 1990-2000 Legend Note: Modes included in transit are Bus or trolley bus; Streetcar or trolley car; Subway or elevated; and Railroad. Universe: Workers: All Workers 16 years and older living in households Data Sources: 2000 ACS: Census 2000 Supplementary Survey (C2SS) 1990 Census Transportation Planning Package (CTPP)
Transit to Work Change in Number of Workers, 1990-2000 Legend Note: Modes included in transit are Bus or trolley bus; Streetcar or trolley car; Subway or elevated; and Railroad. Universe: Workers: All Workers 16 years and older living in households Data Sources: 2000 ACS: Census 2000 Supplementary Survey (C2SS) 1990 Census Transportation Planning Package (CTPP)
Travel Time Comparison for the US • In 2000, the average travel time to work was 24 minutes 20 seconds as compared to 22 minutes 23 seconds in 1990. An increase of almost 2 minutes. Note: Some of this difference may be due to coding changes (of trips > 99 minutes) between 1990 and 2000. The increase may be closer to 1 minute and 24 seconds. • 14.2% of workers now commute more than 45 minutes to work (1990, 12%) • 29% of workers now commute less than 15 minutes to work (1990, 31.4%) Note: “Worked at home” was excluded from “commute less than 15 minutes”
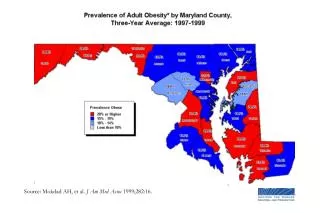
Travel Time: Comparison for States • New York continued to hold the top spot for the longest average travel time at 31 minutes 11 seconds followed by Maryland (29:10), New Jersey (28:41), the District of Columbia (28:32) and Illinois (27:02). • West Virginia had the greatest increase in travel time at 4 minutes and 26 seconds followed by Georgia (4:14) and New Jersey (3:24). • The states with the fastest average travel times continued to be South and North Dakota at 15 minutes 34 seconds and 15 minutes 24 seconds respectively.
Travel Time DistributionU.S. Total, 1990-2000 Note: C2SS did not survey Group Quarter Population. Universe: Workers: All Workers 16 years and older who did not work at home Data Sources: 2000 ACS: Census 2000 Supplementary Survey (C2SS) 1990 Census Transportation Planning Package (CTPP)
Travel Time DistributionTexas, 1990-2000 Note: C2SS did not survey Group Quarter Population. Universe: Workers: All Workers 16 years and older who did not work at home Data Sources: 2000 ACS: Census 2000 Supplementary Survey (C2SS) 1990 Census Transportation Planning Package (CTPP)
Departure TimeU.S. Total,1990 Percent of Workers Departure Time Note: C2SS data release did not include a table with departure time Universe: Workers: All Workers 16 years and older who did not work at home Data Sources: 2000 ACS: Census 2000 Supplementary Survey (C2SS) 1990 Census Transportation Planning Package (CTPP)
Average Travel Time to work Total in minutes, 2000 Legend Note: C2SS did not survey Group Quarter Population. Universe: Workers: All Workers 16 years and older who did not work at home Data Source: 2000 ACS: Census 2000 Supplementary Survey (C2SS)
Commutes more than 45 minutes Change in percent, 1990-2000 Legend Note: C2SS did not survey Group Quarter Population. Universe: Workers: All Workers 16 years and older Data Sources: 2000 ACS: Census 2000 Supplementary Survey (C2SS) 1990 Census Transportation Planning Package (CTPP)
Commutes less than 15 minutes Change in percent, 1990-2000 Legend Note: C2SS did not survey Group Quarter Population. “Worked at home” was excluded from “commute less than 15 minutes” Universe: Workers: All Workers 16 years and older Data Sources: 2000 ACS: Census 2000 Supplementary Survey (C2SS) 1990 Census Transportation Planning Package (CTPP)
Population Change (%) and Change in Average Travel Time (min) to Work 1990-2000 Legend Less than 2 min. Change in Avg. Travel Time 2 – 3 min. More than 3 min. % Population Change More than 20% 5% - 20% Note: C2SS did not survey Group Quarters Universe: Workers: All Workers 16 years and older Population: Persons living in households Less than 5% Data Sources: 2000 ACS: Census 2000 Supplementary Survey (C2SS) 1990 Census Transportation Planning Package (CTPP)
Worker Change (%) and Change in Average Travel time (min) to Work 1990-2000 Less than 2 min. Change in Avg. Travel Time 2 – 3 min. More than 3 min. % Change in number of workers More than 20% Legend Less than 5% 5% - 20% Note: C2SS did not survey Group Quarters Universe: Workers: All Workers 16 years and older Data Sources: 2000 ACS: Census 2000 Supplementary Survey (C2SS) 1990 Census Transportation Planning Package (CTPP)
Vehicle Availability • Percent of households with no vehicles decreased from 11.5% in 1990 to 9.3% in 2000. • By state, the percent of households with no vehicles ranges from 3.5% in Idaho to 28.1% in New York. • Percent of households with 3 or more vehicles increased from 17.3% in 1990 to 18.3% in 2000. • Wyoming has the highest percent of households with 3 or more vehicles (30.2%).
Average Number of Vehicles in Households Total, 2000 Legend Universe: Households: All Households Data Source: 2000 ACS: Census 2000 Supplementary Survey (C2SS)