Download
1 / 18
180 likes | 291 Views
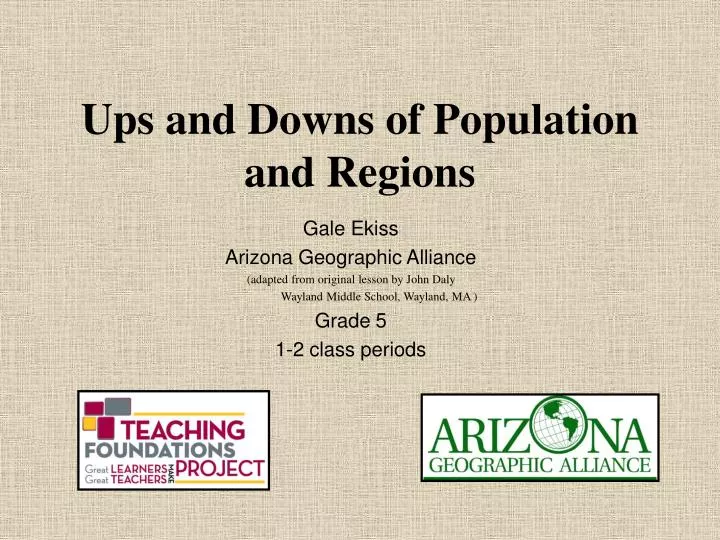
Ups and Downs of Population and Regions. Gale Ekiss Arizona Geographic Alliance (adapted from original lesson by John Daly Wayland Middle School, Wayland, MA ) Grade 5 1-2 class periods. National Geography ELEMENT ONE: THE WORLD IN SPATIAL TERMS

E N D
Ups and Downs of Population and Regions Gale Ekiss Arizona Geographic Alliance (adapted from original lesson by John Daly Wayland Middle School, Wayland, MA ) Grade 5 1-2 class periods
National Geography ELEMENT ONE: THE WORLD IN SPATIAL TERMS 3. How to analyze the spatial organization of people, places, and environments on Earth’s surface. Arizona Geography 5th Grade CONCEPT 1 The World in Spatial Terms PO 1 Describe how the following regions exemplify the concept of region as an area with unifying human or natural factors: West, Midwest, Northeast, Southeast, and Southwest. Standards
Mathematics Common Core Standards Number and Operations in Base Ten 5.NBT.6. Find whole-number quotients of whole numbers with up to four-digit dividends and two-digit divisors, using strategies based on place value, the properties of operations, and/or the relationship between multiplication and division. Illustrate and explain the calculation by using equations, rectangular arrays, and/or area models. Geometry 5.G.2. Represent real world and mathematical problems by graphing points in the first quadrant of the coordinate plane, and interpret coordinate values of points in the context of the situation. Standards for Mathematical Practice 5.MP.2. Reason abstractly and quantitatively. 5.MP.4. Model with mathematics. Standards
Overview Math manipulatives (or Legos) help the kinesthetic learner to understand geographic concepts and see spatial patterns. This lesson will help students formulate a mental map of U.S. regions in terms of population density and elevation of land. Purpose In this lesson, students will learn how the elevation of land can directly relate to the population density of the region. Students will also practice the math skills of division and creating double-bar graphs.
Materials • Several thousand math blocks or Legos bricks that will be divided into small plastic bags. Each bag should contain 84 Legos, unifix cubes, centimeter cubes, or base ten cubes: 42 each of TWO colors. Each bag will be enough for one student or a group of students as the teacher decides. • Small plastic re-sealable bags • If using Legos bricks, green Lego base material cut into 10 inch by 1 1/8 inch strips glued to Masonite board for stability and durability is desirable • Graph paper provided in this lesson • Colored pencils, crayons, or markers • Comparing U.S. Elevation to Population Density student worksheet • Answer key for Comparing U.S. Elevation to Population Density Worksheet • Ups and Downs of Population and Regions map • Ups and Downs of Population and Regions map (no labels) for assessment • Overhead of Physical Regions of the United States map • Overhead of answer key for graph work • Physical map of U.S. without region names • Calculators for students needing adaptations
Objectives The student will be able to: 1. Create a double bar graph of geographic concepts. 2. Practice division of whole numbers. 3. Analyze data that shows elevation of land as it relates to population density.
Procedures Prerequisite math skills: the ability to graph, complete long division problems, and round off numbers to the 100th place. Prerequisite geography skills: knowledge of vocabulary words: elevation, sparse, dense, and population density, and some familiarity with the physical regions of the U.S.
Procedures SESSION ONE 1. Introduce the lesson with a mental mapping exercise. Have the students study the map of Physical Regions of the United States briefly.
Procedures 2. Tell them to raise their right arm to shoulder level (straight out from the side of the body).Tell them their arm is at sea level—the eastern shore of the United States. Explain that they will be moving their arm from its position at the right of the body to their left as we trace in the air (from east to west) across the U.S. according to how high above sea level they think this region will be. Have students begin with the Atlantic Coastal Plain. Is it sea level or higher? Next, say Appalachian Mountains. Have students move their arms to the west and raise it as high as they think the Appalachian region will be. After that, have students move their arms west for the Mississippi River/Great Lakes region. Students should move their arms up or down for the elevation of this region. Continue to have the students move their arms to the west and estimate the elevation of the: Great Plains, Rocky Mountains and Plateaus, Great Basin, Sierra Nevada and Cascade Mountains, and Pacific Coast.
Procedures 3. Next explain the idea behind this lesson. Students just estimated the elevation of the physical regions of the U.S. Now they are going to analyze data and discover how elevation relates to population density. Review what population density means: the AVERAGE number of people living in a square mile. Have the students estimate the population density for their region of the country. 4. Distribute the worksheets. Have the students work in groups or individually to complete the math problems for U.S. Elevation and Population Density. Have them check their work by displaying the overhead of the answer key. Gather their papers and record their scores. Answer Key
Procedures SESSION TWO 1. Distribute bags of the Legos (and their bases) or the math linking blocks, the graph paper, and colored pencils or markers. Pass back their corrected papers from SESSION ONE. 2. Have the students select which of the 2 colored blocks will be elevation and which will be population density. Model for them how to stack the first double-bar graph. Teacher should choose whether to begin at the west with Pacific Coast or begin on the right with the Atlantic Coastal Plain, but the regions must be kept in order from west to east. Pacific Coast = 2 blocks for elevation 8 blocks for population density Sierra Nevada/Cascade Mountains = 7 blocks for elevation 2 blocks for population density Continue until all regions are displayed. (Note: there will be blocks left over of the elevation color.)
Procedures 3. Now have the students use the graph paper to create the same double-bar graph that the manipulatives are showing. Be sure to remind them that the graph needs a title. The class could brainstorm a good title or the teacher can print the title on the whiteboard: Comparing U.S. Elevation to Population Density. Have the students label the two axes. One should be labeled in numbers (500 to 5000) and the other should be labeling the regions (Pacific Coast to Atlantic Coastal Plain).
Procedures 4. Students should separate the blocks or Legos and return them to the bags. All materials should be gathered and returned to the teacher. 5. Students should complete the questions at the bottom of the worksheet. This can be done as homework.
Procedures 6. Have the students share answers on the worksheet to reinforce geography concepts. Ask what two other concepts could be graphed that would show the relationship to either elevation (number of animal species, amount of mining, number of trees) or population density (number of cars, number of economic activities, number of schools).
Assessment The student worksheet can be gradedfor comprehension of geography knowledge. Each question will equal 1 point except for the “Why do you think so?” questions. These can be worth more points. Mastery is considered 80% or higher. The graph can be graded for math (32 points), title (10 points), correctly labeled regions (8 points), key to the colors on the graph (10 points), general neatness (14 points) and correct spelling (10). The final 16 points will come from the worksheet division problems. Mastery is considered 80% or higher.
Extensions • Students can read the land section in the National Geographic Society Reading Expeditions Series: Travels Across America (all five titles: TheWest, The Southeast, The Southwest, The Midwest, and the Northeast) Order #JB41237 and create a summary of what are the specific physical features of this region. • After studying the Physical Regions of the United States map, students can label a map of the U.S with the names of the eight regions used in the lesson as a quiz. • Technology Standards can be applied if the computer is used to do the graphing:
Sources • Adapted from original lesson by John Daly Wayland Middle School, Wayland, MA