Download
1 / 18
190 likes | 579 Views
Concepts of poverty. Jonathan Morduch UNSD June 29, 2005. Structure. INTRODUCTION 2.1 BASIC APPROACHES 2.2 INTERNATIONAL COMPARISONS 2.3 CONSTRUCTING POVERTY MEASURES 2.4 Toward harmonization . Basic approaches. 2.1 BASIC APPROACHES A. Poverty lines

E N D
Concepts of poverty Jonathan Morduch UNSD June 29, 2005
Structure INTRODUCTION 2.1 BASIC APPROACHES 2.2 INTERNATIONAL COMPARISONS 2.3 CONSTRUCTING POVERTY MEASURES 2.4 Toward harmonization
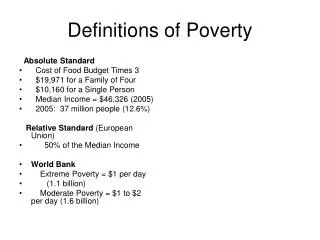
Basic approaches 2.1BASIC APPROACHES A.Poverty lines B.Absolute versus relative notions of poverty. C.Cost of Basic Needs approach D.Households and individuals. E.Adjustments for non-food needs. F.Setting and updating prices.
Food poverty lines • Even when using the WHO/FAO standards, there is considerable variation. • In Armenia and Vietnam, for example, the reported minimum threshold is set at 2100 kcal per person per year--with no adjustment for age, gender, or location. • Senegal: 2400 kilocalories per adults per day (and lower thresholds for others). • In Kenya: 2250 kcal for adult men. • In Sierra Leone and the Gambia: 2700 kcal for adult men. • The differences arise in part because the WHO/FAO standards are specified by age, gender, weight, and activity level—but only age and gender are collected in typical household surveys.
RDA • Age and gender are important indicators of needs, but weight and activity level matter independently—and substantially. • Weight is necessary for determining the basal metabolic rate (BMR) of an individual. • This is the amount of energy consumed merely to get through the day, before extra calories are burned for specific activities. • Experts estimate that the basal metabolic rate accounts for 45 to 70 percent of total energy expenditures for a person of a given age and gender, so adjusting for weight (and thus for BMR) is a critical part of determining minimum calorie needs (WHO/FAO/UNU, 2001, p. 35).
RDA • The rest of energy expenditure is determined by the person’s activity level. • A WHO/FAO/UNU report estimates that a moderately-active 25 year-old man requires at least 2550 kcal per day if he weighs 50 kg. • At 70 kg, though, his minimum requirement rises to 3050 kcal per day (WHO/FAO/UNU, 2001, Table 5.4, p. 41). • The 70 kg man who is sedentary, though, will only require 2550 kcal per day. • In short, weight and activity level matter.
RDA • As noted above, however, neither is collected in a typical household survey. • Thus, while adjustments can be made for age and gender, statisticians must make assumptions about the average activity levels and weights of individuals—and different assumptions have led to different nutritional thresholds. • Given that the use of WHO/FAO standards is so wide, one simple step toward finding more common ground is to reach a consensus on assumptions about weights and activity levels—and thus to arrive at a consensus on food requirements by age and gender.
Non-food cost of basic needs • Roughly half of the respondents to the UNSD survey use the “direct” method (conditional on constructing a poverty line using the “cost of basic needs” approach). • The direct method parallels the way of constructing the food poverty line. • In the Gambia, for example, the list includes: rent, clothing, firewood, transport, education, and health costs. • In Albania, by contrast, the list also includes tobacco and entertainment.
Indirect method • An alternative, indirect method is employed by 63 percent of respondents to the UNSD survey (some use both the direct and indirect methods). • The indirect method is simpler and can capture a wider range of choices. • As an indirect method, though, it may lead to the inclusion of expenditures on alcohol, tobacco, lotteries, certain religious ceremonies, and other categories that might be deemed (rightly or wrongly) inappropriate as constituents of a poverty line designed to measure “basic needs.”
Poverty measures • Analytical use – characterized, hopefully • Descriptive use – transparent, meaningful
Distributionally-sensitive measures • Watts • FGT
Relative weightsFigure 1: Comparison of implicit weights in poverty measures. The weight on an additional $1 of income for poor individuals at different levels, relative to the weight on an additional $1 of income for individuals with income equal to 90 percent of the poverty line. Cubed poverty gap (FGT-3) Relative effect of a $1 transfer Squared poverty gap (FGT-2) Watts index Poverty gap Income (as a percent of the poverty line)
Other issues in choosing measures • Measurement error • Poverty analysis without a poverty line (Simple stochastic dominance)
Exit time • Hypothetical exit times are simple to calculate. If the assumed growth rate is g percent, an individual whose income starts at yi will take T years to exit, where T solves this equation: • The equation can be solved by taking logarithms, yielding that the number of periods of growth required before exit is T = ln(z/yi) / g. • So, for example, if a person’s income starts at a 80 percent of the poverty line and a 5 percent annual growth rate is assumed, their exit time will be ln(100/80) / 0.05 = 4.5 years. • The calculation shows that broad-based and steady growth at 5 percent will be enough to push from poverty everyone whose income is 80 percent of the poverty line or higher.
Average Exit time • This measure, “average exit time,” shares all properties of the Watts index, satisfying both the transfer axiom and the transfer sensitivity axiom.
Median exit times, etc. • The power of the approach can be seen more easily in related calculations completed in the same spirit. • Morduch (2000), for example focuses on the “median exit time” when illustrating the use of exit times with data from Bangladesh. • It is simply: ln(z/yM)/g; the only data required are the poverty line z, the assumed growth rate g, and the median income of the population below the poverty line yM. • The median poor rural household in the 1988-89 Household Expenditure Survey spent Taka 284 per month per capita relative to the poverty line of Taka 370 (in 1989, Tk. 32.1 = $1.) • The calculation shows that, if their expenditures grew steadily at 3 percent per year, it would take just under 9 years to reduce half of rural poverty through income growth alone—ln(370/284)/.03. • A profile of exit times can be constructed for the entire poor population, with exit times calculated for each percentile of income below the poverty line.
Figure 2: Hypothetical exit times as a function of income below the poverty line Years until exit Annual growth rate = 3% 5% 10% Income (as a percent of the poverty line)