Download
1 / 21
210 likes | 291 Views
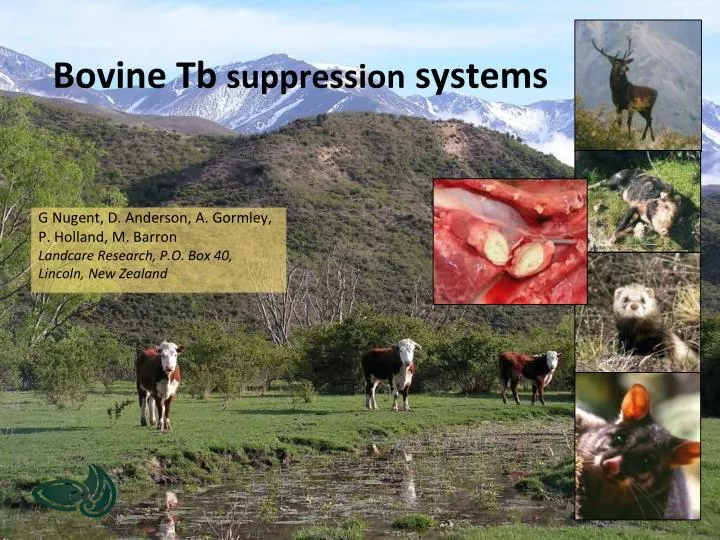
Bovine Tb suppression systems. G Nugent, D. Anderson, A. Gormley, P. Holland, M. Barron Landcare Research, P.O. Box 40, Lincoln, New Zealand. Outline. Progress in reducing TB Switch from control to eradication When to stop Need to ‘prove’ freedom’ Resource allocation problem

E N D
Bovine Tb suppression systems G Nugent, D. Anderson, A. Gormley, P. Holland, M. Barron Landcare Research, P.O. Box 40, Lincoln, New Zealand
Outline • Progress in reducing TB • Switch from control to eradication • When to stop • Need to ‘prove’ freedom’ • Resource allocation problem • Control vs surveillance conundrum • Implications for TB management • ‘Proof of concept’ eradication case study
Progress in reducing TB • 10 mill ha with TB-infected wildlife • But >95% reduction in TB-infected herds since 1994 • Just 69 Infected herds in March 2011
New aims • Success has driven a major change in NPMS-TB goals From: Meeting OIE ‘TB freedom’ requirements • Infected Herd Period Prevalence ≤ 0.2% To: Achieving true eradication of TB - Domestic and wild animal populations become and remain biologically free of M bovis infection
New imperative • Direct economic loss from TB now small (< $1m p.a.) • Not economically sensible to spend $84m p.a. to save such a small amount • High risk that NPMS support may wane before TB fully eradicated? => Crucial that eradication is achieved as swiftly and as cheaply as possible
Specific Eradication Objective • Eradicate TB from wild animals over 2.5 m ha by 2026 • 25% of wildlife-TB area • Must quickly ‘prove’ that TB can be eradicated from large forest tract with a long history of infection • Two ‘Proof of Concept’ areas designated (Hokonui (SI) and Hauhungaroa (NI) Ranges • By 2015/16: • Stakeholders want significant measurable progress towards achieving eradication, especially in the Proof of Concept areas, and efficiencies in vector control
Proof of Freedom Model • LR has developed a quantitative frameworkfor calculating the probability of TB eradication Pest Control History Wildlife Surveillance Livestock Surveillance prior Possum/Sentinel Surveillance Model Livestock Surveillance Model Spatial Possum Model Independent evidence Possums P(Free) Livestock P(Free) Area-wide P(Free)
Key Question • When it is safe to stop vector control (and TB testing) • But ‘proving’ Tb is gone, with high confidence, requires expensive surveillance • Key question is when to shift funding from control to surveillance • Too soon, and $$ wasted showing Tb still present • Too late and $$ wasted on unnecessary control
Resource allocation framework • Each activity increases the estimate of TB eradication probability • But surveillance often does not change actual probability
Resource allocation (2) • POF uses multiple information sources • History of control • TB survey of possums • Tb survey of sentinels • Herd testing • Q: Where is funding best spent?
Eradication proof of concept trialHauhungaroa Ranges (2011-2026) • Compare speed & cost effectiveness of 4 approaches • Standard (conventional broadcast aerial 1080) • trap-catch monitoring, sentinel (pig and deer) Tb survey • Low cost standard (cluster aerial 1080) • trap-catch monitoring, sentinel (pig and deer) Tb survey • Targeted low cost aerial 1080 • Low intensity mapping and surveillance of possums • Ground-based detection & mop up • Intensive control & surveillance of possums
1. Standard broadcast aerial • 3-4 aerial operations at about 5-yearly intervals, with possum abundance assessment plus sentinel (deer and pig) surveys of TB prevalence • Likely to be highly effective • Assuming ultra-low RTCI’s (<0.5%), v high predicted probability of eradication from possum model • But relatively little surveillance data (pig and deer sentinel only) to empirically confirm TB absence. => can we really believe the model predictions?
2. Low-cost cluster aerial • 3-4 aerial operations at c 5-yr intervals, but low-cost ops after the first one – again w. possum abundance assessment plus sentinel (deer and pig) surveys of TB prevalence • Also likely to be highly effective • Assuming low RTCI’s (<2.0%), still high predicted probability of eradication from possum model • But again relatively little surveillance data (pig and deer sentinel only) to empirically confirm TB absence. => Lower cost but less confidence in predictions
Control focussed options • Options 1 & 2 rely on ‘overkill’ - making sure TB has been eradicated by driving the actual probability of TB persistence to miniscule levels • Expensive and risks failure if control is not complete
1.0 0.8 Predicted Actual 0.6 TB prevalence 0.4 0.2 0.0 -1 0 1 2 3 4 5 6 7 8 9 Year after maintenance control Assumptions vs Real World • Model assumes good even control • In reality, there can be gaps in coverage • Famous Hohotaka blackberry patch • Impossible to quantify this risk • => Need for over-kill or empirical surveillance back-up Caley P.; Hickling G.J.; Cowan P.E.; Pfeiffer D.U. 1999. Effects of sustained control of brushtail possums on levels of Mycobacterium bovis infection in cattle and brushtail possum populations from Hohotaka, New Zealand. New Zealand Veterinary Journal 47 133-142
3. Targeted cluster aerial • 3-4 aerial operations at c 5-yr intervals, but ultra-low-cost ops after the first one – targeted only at areas with possums • Later ops cover < 50% of area (v low aerial cost) • Targeted used ground-based mapping with chew cards • Still high predicted probability of eradication • Mapping provides more direct possum surveillance data (plus pig and deer sentinel) to empirically confirm TB absence.
Targeting aerial cluster • CC data used to identify create ‘possum risk’ strata • Areas with few or no possums left out of aerial • Possums can be trapped and necropsied for TB
4. Ground-based detection & mop up • Initial knockdown by aerial (at least two aerial ops), then detection & mop up (DMU) for 5-6 years • Includes possum (as well as deer and pig) surveillance • Control efficacy low (cf aerial) but enough to prevent possum increase and further reduce TB persistence. • Lowest predicted probability of eradication • But abundant possum surveillance data (+ pig + deer) to empirically confirm TB absence.
Surveillance focussed options • Options 3 & 4 aim to do just enough to eradicate TB then gather evidence to show TB has gone • Potentially low cost, less aerial 1080, and faster, but surveillance largely wasted Tb still present
Summary • New Eradication objective is quickly driving a major change in how pests are managed for TB; From: Putting most resources into killing possums to reduce TB To: Putting much more effort into TB surveillance (as well) to achieve and show Tb freedom => Information gathering will become more important than pest control in areas close to being Tb free