Download
1 / 46
460 likes | 576 Views
Reading First in Massachusetts. Review of Student Assessment Data. Presented Online April 13, 2009. Jennifer R. Gordon, M.P.P. Research Manager. Questions Addressed Today. Have student assessment results in participating schools improved over time?

E N D
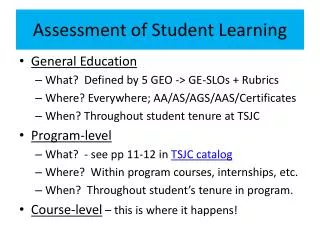
Reading First in Massachusetts Review of Student Assessment Data Presented Online April 13, 2009 Jennifer R. Gordon, M.P.P. Research Manager
Questions Addressed Today • Have student assessment results in participating schools improved over time? • Is there evidence that RF is closing the performance gap for key demographic subgroups? • How effective is instruction for students who entered the year with varying levels of performance? • How do students in participating schools perform on the third grade MCAS? • What are the key factors differentiating students who do and do not attain proficiency on the state’s 3rd grade reading test?
Cross-sectional analysis of grade-level changes • Changes in the demographic profile over time likely to impact observed outcomes • Analysis utilizes a mixed model regression procedure (similar to HLM) controlling for demographic differences in the schools and students being measured • Multi-level repeated measures model with observations (students) nested within larger units (schools) • Student outcomes (changes over time) modeled as a function of both student-level and school-level factors • Statistical significance (p ≤ 0.05) indicates that the observed outcome is more than just a function of the change in demography
Have student assessment results in participating schools improved over time? • Massachusetts relies primarily on results from the DIBELS ORF and GRADE assessments to address the following federal evaluation criteria • Increase in percentage of students performing “at or above grade-level” • DIBELS “Low Risk” and GRADE “Average/Strength” • Decrease in percentage of students with “serious reading difficulties” • DIBELS “At Risk” and GRADE “Weak” • Overall results show that Massachusetts has met these criteria for all grade-levels
DIBELS ORF – RF Cohort 1 Percent Low Risk by grade All cumulative changes from 2004 to 2008 are statistically significant
DIBELS ORF – RF Cohort 1 Percent At Risk by grade All cumulative changes from 2004 to 2008 are statistically significant
DIBELS ORF – RF Cohort 1Change in Mean Score (Words Correct per Minute) • All improvements in mean scores from 2004 to 2008 are statistically significant after controlling for demographic shifts over time. • All spring 2008 means are higher than spring 2007 means (not shown). • In spring 2004 only first grade mean score met the benchmark. By spring 2008, mean scores for all grades are at or above benchmark.
DIBELS ORF – RF Cohort 2 Percent Low Risk by grade All cumulative changes from 2005 to 2008 are statistically significant
DIBELS ORF – RF Cohort 2 Percent At Risk by grade All cumulative changes from 2005 to 2008 are statistically significant
DIBELS ORF – RF Cohort 2Change in Mean Score (Words Correct per Minute) • All improvements in mean scores from 2005 to 2008 are statistically significant after controlling for demographic shifts over time. • First grade mean scores for both spring 2005 and spring 2008 exceed the benchmark.
GRADE Total Test – RF Cohort 1 Percent Average/Strength by grade All cumulative changes from 2004 to 2008 are statistically significant
GRADE Total Test – RF Cohort 1 Percent Weak by grade All cumulative changes from 2004 to 2008 are statistically significant
Interpretation of Changes in Mean Standard Score • Source: Journal of School Improvement, formerly published by the North Central Association Commission on Accreditation and School Improvement • Magnitude of GainInterpretation • 0.10 - 0.19 SU meaningful; worth mentioning • 0.20 – 0.29 SU quite good • 0.30 SU or greater substantial; impressive • (www.ncacasi.org/jsi/2000v1i2/standard_score)
GRADE Total Test – RF Cohort 1Change in Mean Std. Score • Standard score of 100 is average for student’s grade. Standard deviation of standard score is 15. • All changes in mean score (not shown) are statistically significant • Interpretation taken from Journal of School Improvement
GRADE Total Test – RF Cohort 2 Percent Average/Strength by grade Cumulative changes for grades 1 and 2 are statistically significant
GRADE Total Test – RF Cohort 2 Percent Weak by grade Cumulative changes for grades 1 and 3 are statistically significant
GRADE Total Test – RF Cohort 2Change in Mean Std. Score • Standard score of 100 is average for student’s grade. Standard deviation of standard score is 15. • All changes in mean score (not shown) are statistically significant • Interpretation taken from Journal of School Improvement
Haverhill/Walnut Square (92%) Plymouth/West (90%) Westfield/Moseley (89%) Narragansett/Baldwinville (86%) Plymouth/South (86%) Revere Garfield (85%) Taunton/Walker (84%) Cambridge/Haggerty (82%) Community Day Charter (81%) Methuen/Tenney (81%) Westfield/Franklin Ave (80%) Boston Renaissance (80%) GRADE – Schools with 80% or more at benchmarkAll Reading First cohorts • Since they began program implementation, about 70 percent of RF schools have demonstrated increases in the proportion of students in the average/strength category AND decreases in the proportion of students in the weak category. • These included about 27 percent of schools which showed substantial improvement, with average/strength increases AND weak decreased of at least 10 percentage points.
Is there evidence that RF is closing the performance gap for key demographic subgroups? • Nearly demographic subgroups have shown improvement in overall reading skills as measured by GRADE. • The exception is for African American students in RF Cohort 2 who have shown a very small decline in A/S performance • Of particular note are subgroups with levels of improvement which meaningfully exceed the general population • An indication that the performance gap for these students is narrowing • Cohort 1: SPED, LEP, Hispanic • Cohort 2: LEP • There were no subgroups with levels of improvement that were meaningfully smaller than the general population • An indication that the performance gap for these students is widening
GRADE Total Test – Third Grade SubgroupsRF Cohort 1 Percent Average/Strength Cumulative change for low income students is statistically significant
GRADE Total Test – Third Grade Subgroups (cont)RF Cohort 1 Percent Average/Strength Cumulative change for Hispanic students is statistically significant
RF Cohort 1 SubgroupsChange in GRADE Mean Std Score – 2004 vs. 2008 Subgroup results compared to All Students ** Quite good improvement * Meaningful improvement ^ Meaningful lag
GRADE Total Test – Third Grade SubgroupsRF Cohort 2 Percent Average/Strength Cumulative changes are not statistically significant
GRADE Total Test – Third Grade Subgroups (cont)RF Cohort 2 Percent Average/Strength Cumulative change for Hispanic students is statistically significant
RF Cohort 2 SubgroupsChange in GRADE Mean Std Score – 2005 vs. 2008 Subgroup results compared to All Students ** Quite good improvement * Meaningful improvement ^ Meaningful lag
How effective is instruction for students who entered the year with varying levels of performance? • Effectiveness for Average/Strength Students: calculated for students scoring in the average/strength categories in the fall and provides the percentage of those students who are still scoring at that level in the spring. • Effectiveness for Low Average Students: calculated for those students scoring in the low average category in the fall and provides the percentage of those students scoring at the average/strength level in the spring. • Effectiveness for Weak Students: is calculated for those students scoring in the weak category in the fall and provides the percentage of those students scoring at low average or above in the spring. • Developed by Florida Center for Reading Research (FCRR) using DIBELS. Massachusetts uses GRADE to provide a measure of overall reading ability.
Findings: Instructional Effectiveness • Among students who began the school year: • In Average/Strength categories (stanines 5-9) • About 95% ended the year at or above benchmark • More than half improved their performance by one or more stanine • In the Low Average category (stanine 4) • About 70% ended the year in average/strength • Instruction had a substantial impact at all grade levels and was most effective for first graders, especially in regard to moving from low average to strength • In the Weak Category (stanines 1-3) • More than half ended the year in low average or higher • Instruction was most effective for first graders, about 47% moved from weak to average/strength
Effectiveness for “Average/Strength” Students (2007-2008 All RF Cohorts) 46 52 68 97 96 93
Effectiveness for “Low Average” Students (2007-2008 All RF Cohorts) 68 66 76
Effectiveness for “Weak” Students (2007-2008 All RF Cohorts) 56 65 44
How do students in participating schools perform on the third grade MCAS? • Despite improvement on the DIBELS and GRADE, skills have not improved enough to yield improvement on the more challenging MCAS Reading test. • Overall performance levels are lower, but the performance trend for RF students is consistent with statewide data showing declines in proficiency and increases in warning. • Needs Improvement is more consistent with “grade-level” performance on nationally-normed assessments • In 2008, 89 percent of students statewide met or exceeded NI as did 77 percent of RF students
Key Differences: GRADE Level 3 Form B compared to 2008 Grade 3 MCAS Reading • Nature of the items • GRADE measures a combination of decoding and comprehension skills whereas MCAS is almost exclusively comprehension questions • GRADE includes only multiple choice items whereas MCAS also includes two open-response items. • Passage “difficulty” • GRADE totals 849 words with an average of 121 words per passage. Passages range from 45 to 196 words. Predominantly text constructed specifically for the test. • MCAS totals 4,221 words with an average of 603 words per passage. Passages range from 136 to 1,005 words. All text taken from literature.
MCAS Third Grade Reading TestStatewide Results – 2003 to 2008
MCAS Third Grade Reading TestCohort 1 Results – 2003 to 2008
MCAS Third Grade Reading TestCohort 2 Results – 2004 to 2008
“Needs Improvement” is more consistent with “grade-level” performance on nationally-normed tests
2008 MCAS results – School-level • Wide disparities in MCAS performance among schools • Proficiency • 6 schools equal or better than the statewide rate of 56% • 28 schools at 25% proficiency or less • Warning • 11 schools had warning rates equal or better than the statewide rate of 11%, including 3 schools at 0% • 19 schools had warning rates of 33% or more • Only 11 schools showed both increases in proficiency and decreases in warning • 3 schools with substantial improvement (10 or more points)
2008 MCAS– Top Performing RF Schools • Proficiency at or above state average • Westfield – Moseley (78%) • Plymouth – South Elem. (75%) • Westfield – Franklin Ave (73%) • Boston Renaissance Charter (65%) • North Adams – Brayton (60%) • Plymouth – West Elem. (56%) • Statewide proficiency is 56% • Warning at or below state average • Westfield – Moseley (0%) • Plymouth – South Elem. (0%) • Westfield – Franklin Ave (0%) • Boston Renaissance Charter (3%) • Gill-Montague – Sheffield (3%) • Boston – Perkins (3%) • Plymouth – West Elem. (5%) • Chicopee – Stefanik (5%) • Robert M. Hughes Academy (9%) • North Adams – Brayton (10%) • West Springfield – Coburn (11%) • Statewide warning is 11%
MCAS–Schools with “Substantial” ImprovementProficiency Increases and Warning Decreases of 10+ points
What key factors differentiate students who do and do not attain proficiency on the MCAS? • Conducted analysis for all RF and Silber 3rd graders with spring 2008 GRADE results in the average/strength categories (stanine 5-9) • Compared performance of proficient and not-proficient students on the following items: • DIBELS ORF: percent low risk • GRADE subtests: percent at or above benchmark • Individual MCAS passages and test questions (including multiple-choice vs. open-response items)
Key Factors in ProficiencyAll RF and Silber Cohorts * Difference in percentage between proficient and non-proficient students with similar GRADE performance are statistically significant (chi-square)
Key Factors in Proficiency (continued) Individual MCAS Passages • * Difference between NP and P students is disproportionate to the difference in their overall MCAS results (4+ pts greater than the total test mean pct correct)
The Open Response Challenge • On the two passages with both multiple choice and open response items, RF students perform much better on the multiple choice items than the open response items – regardless of their MCAS proficiency and GRADE scores.
Findings – Opportunities for improving MCAS performance • Developing faster and more accurate decoding skills • Practicing with longer and more difficult authentic text – including high quality expository text • Building receptive vocabulary • Developing strategies to infer meaning from text • Helping students respond to literature – especially in writing
Summary • In Massachusetts, RF has had positive measurable impacts on student skills including improving the performance of students who begin the year at moderate or substantial risk. • Yet, it remains important for the state to develop a better understanding of the challenges that limit improvement, particularly on MCAS and provide the necessary PD and support to move forward. • Survey responses indicate that RF staff are generally quite positive about the program’s impact on their knowledge and practice with regard to effective reading instruction. In the long run, this holds the potential to positively impact students’ reading skills once program funding is gone.
For additional information, please contact: Jennifer Gordon, Research Manager 508-856-1349 jgordon@donahue.umassp.edu UMass Donahue Institute 333 South Street, Suite 400 Shrewsbury, MA 01545 www.donahue.umassp.edu