Download
1 / 48
490 likes | 595 Views
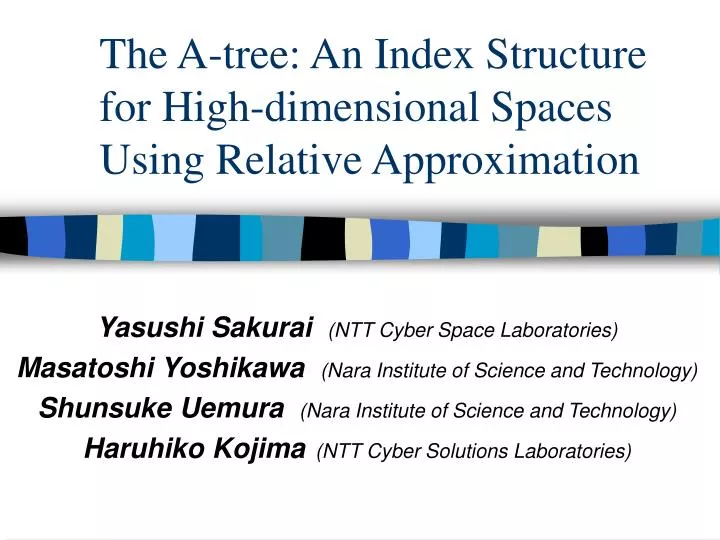
The A-tree: An Index Structure for High-dimensional Spaces Using Relative Approximation. Yasushi Sakurai (NTT Cyber Space Laboratories) Masatoshi Yoshikawa (Nara Institute of Science and Technology) Shunsuke Uemura (Nara Institute of Science and Technology)

E N D
The A-tree: An Index Structure for High-dimensional Spaces Using Relative Approximation Yasushi Sakurai(NTT Cyber Space Laboratories) Masatoshi Yoshikawa(Nara Institute of Science and Technology) Shunsuke Uemura(Nara Institute of Science and Technology) Haruhiko Kojima(NTT Cyber Solutions Laboratories)
Introduction • Demand • High-performance multimedia database systems • Content-based retrieval with high speed and accuracy • Multimedia databases • Large size • Various features, high-dimensional data • More efficient spatial indices for high-dimensional data
Our Approach • VA-File and SR-tree are excellent search methods for high-dimensional data. • Comparisons of them motivated the concept of the A-tree. • No comparisons of them have been reported. • We performed experiments using various data sets • Approximation tree (A-tree) • Relative approximation: MBRs and data objects are approximated based on their parent MBR. • About 77% reduction in the number of page accesses compared with VA-File and SR-tree
R1 Non-leaf Node R3 R2 R1 R2 R8 R5 R6 Leaf Node R4 R7 R3 R4 R5 R6 R7 R8 Related Work (1) • R-tree family • Tree structure using MBRs (Minimum Bounding Rectangles) and/or MBSs (Minimum Bounding Spheres) • SR-tree: • Structured by both MBRs and MBSs • Outperforms SS-tree and R*-tree for 16-dimensional data
Related Work (2) • VA-File (Vector Approximation File) • Use approximation file and vector file 1. Divide the entire data space into cells 2. Approximate vector data by using the cells, then create the approximation file 3. Select candidate vectors by scanning the approximation file 4. Access to the candidate vectors in the vector file • Better than X-tree and R*-tree beyond dimensionality of 6 11 10 Approximation Vector Data 01 10 11 0.6 0.8 00 11 00 0.9 0.1 00 01 10 11
Experimental Results and Analysis --- Properties of the SR-tree --- • Structure suitable for non-uniformly distributed data • Structure changes according to data distribution. • Large entry size for high-dimensional spaces • Large entries small fanout many nodeaccesses • Changing node size and fanout • Larger node size does NOT lead to low IO cost. • Larger fanout always contributes to the reduction in node accesses. • MBS contribution • The contribution of MBSs in node pruning is small in high-dimensional spaces.
Experimental Results and Analysis --- Properties of the VA-File --- • Data skew degenerates search performance. • Absolute approximation: the approximation is independent of data distribution. • Effective for uniformly distributed data • Unsuitable for non-uniformly distributed data • A large amount of dense data tends to be approximated by the same value. • Absolute approximation leads to large approximation errors.
The A-tree (Approximation tree) • Ideas from the SR-tree and VA-File comparison: • Tree structure • Tree structures are suitable for non-uniformly distributed data. • Relative approximation • MBRs and data objects are approximated based on their parent bounding rectangle. • Small approximation error • Small entry size and large fanout low IO cost • Partial usage of MBSs in high-dimensional searches • MBSs are not stored in the A-tree. • The centroid of data objects in a subtree is used only for update.
Virtual Bounding Rectangle (VBR) • C approximates a rectangleB. • C is calculated fromrectanglesAand B. • Search using VBRs guarantees the same result as that of MBRs. Rectangle A (4, 20) (28, 20) (10, 16) (22, 16) VBR C (11, 15) (21, 15) Rectangle B (11, 11) (21, 11) (22, 10) (10, 10) (4, 4) (28, 4)
Subspace Code • Subspace code represents a VBR. • The edge of child MBR Bis quantized in relation to the edge of parent MBR A. • The edge of B is approximated as a pair of 8-ary codes (1, 2) or binary codes (001, 010). 3 19 Edge of rectangleA 6 8 Edge of rectangle B 0 1 2 3 4 5 6 7 i-th dimensional coordinate axis
Subspace Code • C is the VBR of B in A • C is represented by the subspace codes: S = (010, 011, 101, 101) Rectangle A VBR C 101 Rectangle B 011 010 101
The A-tree Structure • Relative approximation: • MBRs and data objects in child nodes are approximated based on parent MBR. • Configuration • One node contains partial information of rectangles in two consecutive generations. R (Entire space) P1 SC(V1) SC(V2) CD1 CD2 M1 C1 C2 M3 M1 SC(V3) SC(V4) CD3 CD4 M2 P2 V3 V2 V4 M2 M3 SC(C1) SC(C2) M4 M4 V1 P1 P2
The A-tree Structure P1 and P2: data objects, R (Entire space) P1 SC(V1) SC(V2) CD1 CD2 M1 C1 C2 M3 M1 SC(V3) SC(V4) CD3 CD4 M2 P2 V3 V2 V4 M2 M3 SC(C1) SC(C2) M4 M4 V1 P1 P2
The A-tree Structure P1 and P2: data objects, M1 -- M4: MBRs R (Entire space) P1 SC(V1) SC(V2) CD1 CD2 M1 C1 C2 M3 M1 SC(V3) SC(V4) CD3 CD4 M2 P2 V3 V2 V4 M2 M3 SC(C1) SC(C2) M4 M4 V1 P1 P2
The A-tree Structure P1 and P2: data objects, M1 -- M4: MBRs SC(V1) -- SC(V4): subspace codes of VBRs for the MBRs R (Entire space) P1 SC(V1) SC(V2) CD1 CD2 M1 C1 C2 M3 M1 SC(V3) SC(V4) CD3 CD4 M2 P2 V3 V2 V4 M2 M3 SC(C1) SC(C2) M4 M4 V1 P1 P2
The A-tree Structure P1 and P2: data objects, M1 -- M4: MBRs SC(V1) -- SC(V4): subspace codes of VBRs for the MBRs R (Entire space) P1 SC(V1) SC(V2) CD1 CD2 M1 C1 C2 M3 M1 SC(V3) SC(V4) CD3 CD4 M2 P2 V3 V2 V4 M2 M3 SC(C1) SC(C2) M4 M4 V1 P1 P2
The A-tree Structure P1 and P2: data objects, M1 -- M4: MBRs SC(V1) -- SC(V4): subspace codes of VBRs for the MBRs R (Entire space) P1 SC(V1) SC(V2) CD1 CD2 M1 C1 C2 M3 M1 SC(V3) SC(V4) CD3 CD4 M2 P2 V3 V2 V4 M2 M3 SC(C1) SC(C2) M4 M4 V1 P1 P2
The A-tree Structure P1 and P2: data objects, M1 -- M4: MBRs SC(V1) -- SC(V4): subspace codes of VBRs for the MBRs R (Entire space) P1 SC(V1) SC(V2) CD1 CD2 M1 C1 C2 M3 M1 SC(V3) SC(V4) CD3 CD4 M2 P2 V3 V2 V4 M2 M3 SC(C1) SC(C2) M4 M4 V1 P1 P2
The A-tree Structure P1 and P2: data objects, M1 -- M4: MBRs SC(V1) -- SC(V4): subspace codes of VBRs for the MBRs SC(C1) and SC(C2): subspace codes of VBRs for the data objects R (Entire space) P1 SC(V1) SC(V2) CD1 CD2 M1 C1 C2 M3 M1 SC(V3) SC(V4) CD3 CD4 M2 P2 V3 V2 V4 M2 M3 SC(C1) SC(C2) M4 M4 V1 P1 P2
The A-tree Structure P1 and P2: data objects, M1 -- M4: MBRs SC(V1) -- SC(V4): subspace codes of VBRs for the MBRs SC(C1) and SC(C2): subspace codes of VBRs for the data objects R (Entire space) P1 SC(V1) SC(V2) CD1 CD2 M1 C1 C2 M3 M1 SC(V3) SC(V4) CD3 CD4 M2 P2 V3 V2 V4 M2 M3 SC(C1) SC(C2) M4 M4 V1 P1 P2
The A-tree Structure P1 and P2: data objects, M1 -- M4: MBRs SC(V1) -- SC(V4): subspace codes of VBRs for the MBRs SC(C1) and SC(C2): subspace codes of VBRs for the data objects CD1 -- CD4: centroid of the data objects in the subtree R (Entire space) P1 SC(V1) SC(V2) CD1 CD2 M1 C1 C2 M3 M1 SC(V3) SC(V4) CD3 CD4 M2 P2 V3 V2 V4 M2 M3 SC(C1) SC(C2) M4 M4 V1 P1 P2
The A-tree Structure • Data nodes • Index nodes • leaf nodes • intermediate nodes • root node SC(V1) SC(V2) CD1 CD2 Index nodes M1 SC(V3) SC(V4) CD3 CD4 M2 M3 SC(C1) SC(C2) M4 Data nodes P1 P2
The A-tree Structure • Data node • data objects • pointers to the data description records SC(V1) SC(V2) CD1 CD2 Index nodes M1 SC(V3) SC(V4) CD3 CD4 M2 M3 SC(C1) SC(C2) M4 Data nodes P1 P2 Data node
The A-tree Structure • Leaf node • an MBR • a pointer to the data node • subspace codes of VBRs SC(V1) SC(V2) CD1 CD2 Index nodes M1 SC(V3) SC(V4) CD3 CD4 M2 Leaf nodes M3 SC(C1) SC(C2) M4 Data nodes P1 P2
The A-tree Structure • Intermediate node • an MBR • a list of entries • a pointer to the child node • the subspace code of a VBR • the centroid of data objects in the subtree • the number of the data objects SC(V1) SC(V2) CD1 CD2 Index nodes M1 SC(V3) SC(V4) CD3 CD4 M2 Intermediate nodes M3 SC(C1) SC(C2) M4 Data nodes P1 P2
The A-tree Structure • Root node: • a list of entries • a pointer to the child node • the subspace code of a VBR • the centroid of data objects in the subtree • the number of the data objects Root node SC(V1) SC(V2) CD1 CD2 Index nodes M1 SC(V3) SC(V4) CD3 CD4 M2 M3 SC(C1) SC(C2) M4 Data nodes P1 P2
Search Algorithm • Basic ideas: • VBRs are calculated from parent MBR and the subspace codes. • Exception: the entire space is used in the root node. • The algorithm uses calculated VBRs for pruning. R (Entire space) P1 SC(V1) SC(V2) Root node C1 C2 M3 P2 M1 SC(V3) SC(V4) M2 V3 V2 V4 M2 M3 SC(C1) SC(C2) M4 M4 M1 V1 P1 P2
Search Algorithm • Calculate V1 and V2 from R, SC(V1) and SC(V2) R (Entire space) Query point P1 SC(V1) SC(V2) C1 C2 M3 P2 M1 SC(V3) SC(V4) M2 V3 V2 V4 M2 M3 SC(C1) SC(C2) M4 M4 M1 V1 P1 P2
Search Algorithm • Calculate V1 and V2 from R, SC(V1) and SC(V2) • Calculate V3 and V4 from M1, SC(V3) and SC(V4) R (Entire space) Query point P1 SC(V1) SC(V2) C1 C2 M3 P2 M1 SC(V3) SC(V4) M2 V3 V2 V4 M2 M3 SC(C1) SC(C2) M4 M4 M1 V1 P1 P2
Search Algorithm • Calculate V1 and V2 from R, SC(V1) and SC(V2) • Calculate V3 and V4 from M1, SC(V3) and SC(V4) • Calculate C1 and C2 from M3, SC(C1) and SC(C2) R (Entire space) Query point P1 SC(V1) SC(V2) C1 C2 M3 P2 M1 SC(V3) SC(V4) M2 V3 V2 V4 M2 M3 SC(C1) SC(C2) M4 M4 M1 V1 P1 P2
Search Algorithm • Calculate V1 and V2 from R, SC(V1) and SC(V2) • Calculate V3 and V4 from M1, SC(V3) and SC(V4) • Calculate C1 and C2 from M3, SC(C1) and SC(C2) • Access to P1 R (Entire space) Query point P1 SC(V1) SC(V2) C1 C2 M3 P2 M1 SC(V3) SC(V4) M2 V3 V2 V4 M2 M3 SC(C1) SC(C2) M4 M4 M1 V1 P1 P2
Update Algorithm • Basic idea: • Based on the update algorithm of the SR-tree, but: • Needs to update subspace codes SC(V1) SC(V2) CD1 CD2 M1 SC(V3) SC(V4) CD3 CD4 M2 M3 SC(C1) SC(C2) SC(C3) M4 P1 P2 P3
Code Calculation VBRs Parent MBR
Code Calculation • If parent MBRdoes not change, calculate the subspace code for the inserted data object. VBRs Inserted point Parent MBR
Code Calculation • If parent MBRdoes not change, calculate the subspace code for the inserted data object. • If parent MBR changes, calculate all subspace codes VBRs Inserted point Parent MBR Inserted point
Update Algorithm • Update data node and leaf node • Insert a new data object P3 • UpdateM3 SC(V1) SC(V2) CD1 CD2 M1 SC(V3) SC(V4) CD3 CD4 M2 M3 SC(C1) SC(C2) SC(C3) M4 P1 P2 P3
Update Algorithm • Update data node and leaf node • Insert a new data object P3 • UpdateM3 • If M3does not change, calculate SC(C3). SC(V1) SC(V2) CD1 CD2 M1 SC(V3) SC(V4) CD3 CD4 M2 M3 SC(C1) SC(C2) SC(C3) M4 P1 P2 P3
Update Algorithm • Update data node and leaf node • Insert a new data object P3 • UpdateM3 • If M3does not change, calculate SC(C3). • If M3 changes, calculate SC(C1), SC(C2) and SC(C3). SC(V1) SC(V2) CD1 CD2 M1 SC(V3) SC(V4) CD3 CD4 M2 M3 SC(C1) SC(C2) SC(C3) M4 P1 P2 P3
Update Algorithm • Update intermediate node • If M3 changes, updateM1. • If M3 changes but M1 does not change, calculate SC(V3). • If M1 changes, calculate SC(V3),SC(V4). • Calculate CD3 SC(V1) SC(V2) CD1 CD2 M1 SC(V3) SC(V4) CD3 CD4 M2 M3 SC(C1) SC(C2) SC(C3) M4 P1 P2 P3
Update Algorithm • Update root node • If M1changes, calculate SC(V1) • Calculate CD1 SC(V1) SC(V2) CD1 CD2 M1 SC(V3) SC(V4) CD3 CD4 M2 M3 SC(C1) SC(C2) SC(C3) M4 P1 P2 P3
Performance Test • Data sets: real data set (hue histogram image data), uniformly distributed data set, cluster data set. • Data size: 100,000 • Dimension: varies from 4 to 64 • Page size: 8 KB • 20-nearest neighbor queries • Evaluation is based on the average for 1,000 insertion or query points. • CPU: 296 MHz • Code length: • The code length that gave the best performance was chosen. • A-tree: code length varies from 4 to 12. • VA-File: code length varies from 4 to 8 according to [18].
Search Performance • A-tree gives significantly superior performance! • 77% reduction in number of page accesses for 64-dimensional real data • Relative approximation • Small entry size and large fanout low IO cost Real data Uniformly distributed data
Influence of Code Length • Approximation error ε: error of the distance between p and Vi during a search p: query point, S: the number of visited VBRs, Vi: visited VBRs, Mi : the MBRs corresponding to Vi • Optimum code length depends on dimensionality and data distribution
VA-File/A-tree Comparison • VA-File (absolute approximation) • approximated using the entire space edge length 2-l • A-tree (relative approximation) • approximated using parent MBR smaller VBR size, fewer object accesses Edge length of VBRs/cells Number of data object accesses
CPU-time • CPU-time for real data • Similar to the SR-tree and outperforms the VA-File • VA-File • Calculates the approximated position coordinate for all objects • A-tree • Reducing node accesses leads to low CPU cost.
Insertion and Storage Cost • Increase in the insertion cost is modest. • About 20% less storage cost for 64-dimensional data (1) VBRs need only small storage volumes. (2) The number of index nodes is extremely small. Insertion cost Storage cost
Conclusions • The A-tree offers excellent search performance for high-dimensional data • Relative approximation • MBRs and data objects in child nodes are approximated based on parent MBR. • About 77% reduction in the number of page accesses compared with VA-File and SR-tree • Future work • Cost model for finding optimum code length
Contribution of MBSs for Pruning • SR-tree contains both MBRs and MBSs but: the frequency of the usage of MBSs decreases as dimensionality increases.