Download
1 / 14
140 likes | 280 Views
Linear and non linear persistence in climate and its effect on the extremes. Armin Bunde, Sabine Lennartz, Mikhail Bogachev Justus-Liebig Universität Giessen. In cooperation with: E. Koscielny-Bunde (Giessen), H.J. Schellnhuber (PIK),

E N D
Linear and non linear persistence in climate and its effect on the extremes Armin Bunde, Sabine Lennartz, Mikhail Bogachev Justus-Liebig Universität Giessen In cooperation with: E. Koscielny-Bunde (Giessen), H.J. Schellnhuber (PIK), S. Havlin (Tel Aviv), D. Rybski (Giessen, PIK) H. v. Storch (GKSS), J. Eichner (Giessen, Re Munich)
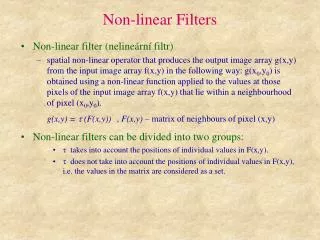
I. Linear long-term correlations in climate white noise 1/f noise non stationary i i Seasonal mean Climate records: Analysis problems:Finite Size Effects, Trends Seasonal standard deviation
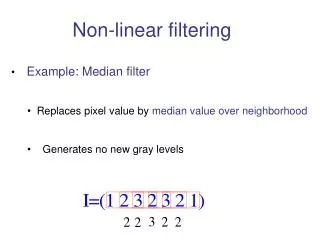
Alternative: Fluctuation analysis Advantage: Modifications (DFA1, DFA2, ...Wavelet Methods) allow to detect long-term correlations in the presence of trends, with reduced finite size effects For the inverse problem of trend detection in the presence of long-term memory, with application to anthropogenic global warming,see talk by Sabine Lennartz on Thursday
Summary of the fluctuation exponents: (a) Observational data J.Eichner et al, 2003, D. Rybski et al, 2004, 2006, E. Koscielny-Bunde et al, 1996, 1998, 2004
(b) Model temperature data (1 000y): Erik the Red (Hamburg), D. Rybski, A. Bunde, H. v. Storch, 2008, see also Fraedrich + Blender, 2006
II Extreme events Q Q Q threshold Q return intervals ri Result for long-term correlated records with correlation exponent : The return intervals are (a) long-term correlated with the same (b) and their probability density scales as A. Bunde, J. Eichner, S. Havlin, J. Kantelhardt, 2005
Comparison with paleo-climate data A. Bunde, J. Eichner, S. Havlin, J. Kantelhardt, 2005
??? t ∆t III Risk estimation: Hazard function Assume: Last Q-exceeding event occured t time units ago. We are interested in the probability that within the next time units at least one event occurs: trivial prediction linear long-term correlations strong nonlinear correlations A. B., J. Eichner, J.Kantelhardt, S. Havlin, 2005; M. Bogachev, A.B., 2007, 2010
IV Precipitation and river run-offs Cascade model: days days Precipitation To obtain the proper α-value, we shift the multifractal spectrum by H´ River run-offs
V Non linear correlations: Multifractality Generalized fluctuation function depends on q: Multifractality See also: Schertzer, Lovejoy et al, Kantelhardt et al, Koscielny- Bunde et al, 2000-2006
VI PDF of the return intervals Pronounced power law behavior independent of α, result of strong nonlinear memory Weak deviations from exponential: result of weak linear and nonlinear memory .
Instrumental recordHistorical runControl runHistorical run (biannual) Instrumental recordHistorical run Historical run Reconstructed record (Kaplan)Historical runControl runHistorical run (biannual)