Download
1 / 35
370 likes | 532 Views
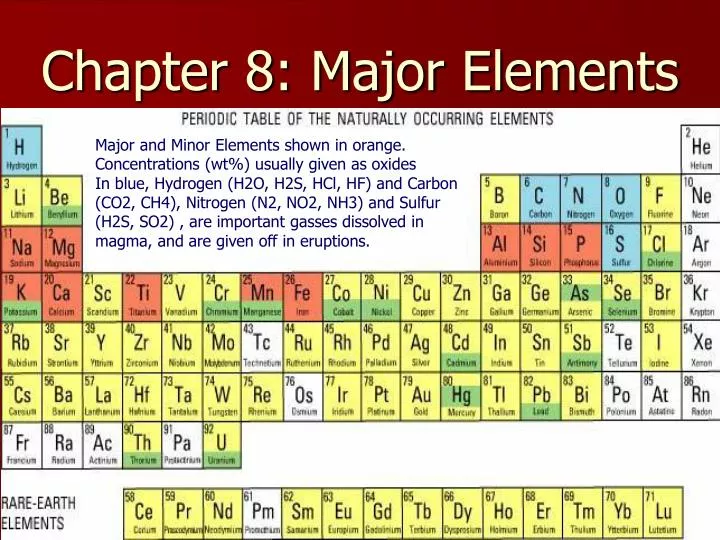
Major and Minor Elements shown in orange. Concentrations (wt%) usually given as oxides In blue, Hydrogen (H2O, H2S, HCl, HF) and Carbon (CO2, CH4), Nitrogen (N2, NO2, NH3) and Sulfur (H2S, SO2) , are important gasses dissolved in magma, and are given off in eruptions. Chapter 8: Major Elements.

E N D
Major and Minor Elements shown in orange. Concentrations (wt%) usually given as oxides In blue, Hydrogen (H2O, H2S, HCl, HF) and Carbon (CO2, CH4), Nitrogen (N2, NO2, NH3) and Sulfur (H2S, SO2) , are important gasses dissolved in magma, and are given off in eruptions. Chapter 8: Major Elements
Element Wt % Oxide Atom % O 60.8 Si 59.3 21.2 Al 15.3 6.4 Fe 7.5 2.2 Ca 6.9 2.6 Mg 4.5 2.4 Na 2.8 1.9 Abundance of the elements in the Earth’s crust Major elements: usually greater than 1% SiO2 Al2O3 ( Iron as FeO, Fe2O3) MgO CaO Na2O K2O H2O Minor elements: usually 0.1 - 1% TiO2MnO P2O5 CO2 Trace elements: usually < 0.1% everything else Usually given as Oxides
Weighing Elements in Rocks Spectroscopy • Recall that the wavelength l (color) of light is related to the speed vand the frequency f. • Also as a light wave front changes velocity while moving into a different medium, it refracts, that is it changes its direction θ. Snell’s Law
If you pass white light through a prism, the different wavelengths are refracted at different angles according to Snell’s Law white light A hot gas gives off characteristic colors of light, corresponding to the photon given off when an excited electron loses energy while falling back to its normal state Light from hot glowing gas The same gas, if cold, absorbs those characteristic colors of light, letting the rest of the spectrum pass white light Positions of emission and absorption lines same
Chapter 8: Major Elements ICP samples are dissolved, then mixed with Argon gas as they are aspirated into a Radio-frequency generator. A plasma is created, and the emissions are spread out with a grating and compared to standards. AA: solution aspirated into a flame, and a beam of light of predetermined wavelength is passed through the flame. The absorption is compared to standards. We have an old one in storage. Inductively Coupled Plasma Modern Spectroscopic Techniques Atomic Absorption Figure 8-1. The geometry of typical spectroscopic instruments. From Winter (2001) An Introduction to Igneous and Metamorphic Petrology. Prentice Hall.
Mass Spectrometer 2nd floor, Spectroscopy Lab Sample is injected, then ionized in a strong electrical field. The charged particles move toward plates of opposite charge, then pass through a variable electromagnet. For each magnetic field strength, only one atomic mass (green dashed line) will pass to the detector. Isotopes vary in mass and so can be counted.
Electron Microprobe • A beam of electrons is focused on the specimen, and these energetic electrons produce characteristic X-rays within a small volume of the specimen. The characteristic X-rays are detected at particular wavelengths, and their intensities are measured to determine concentrations. All elements (except H, He, and Li) can be detected because each element has a specific set of X-rays that it emits.
Atoms • All atoms with the same number of protons (same atomic #) are said to be the same element • Atoms belonging to the same element may have different numbers of neutrons. Each case is referred to as a different Isotope of that element. 12C vs14C 16O vs18O • Charged atoms (called ions) have more or fewer electrons than the neutral atom • Recall that positive ions (missing electrons) are called cations. Examples Fe++ Fe+3 Na+ K+ Mg++ Ca++ Al+3 Si+4 • And negative ions are called anions. Examples OH- O-2, S-- , Cl- F-
Table 8.1 Chemical analysis of a Basalt, Mid-Atlantic Ridge H2O+ (structural water) is present as OH- bonded as in hydrous minerals such as Amphiboles and micas H2O- is adsorbed water, or trapped water along mineral grain boundaries LOI loss on ignition is weight loss after heated to 800oC, removes structural water. Absorbed/trapped water lost previously at 100oC (Col 1/Col 2) x # cations in oxide x 100 (Column 3/ sum of col 3) x 100 My Oxygen Prop calcs
Given Analysis Compute Mole percents Pyroxenite Jadeite is NaAlSi2O6 Diopside is CaMgSi2O6We are given the following chemical analysis. Oxide Wt% MolWt Moles Moles Moles Prop. Cations to O6 Oxide Oxide Cation Oxygen • SiO2 56.64 60.086 .9426 .9426 1.8852 .9426 x 6/2.8278 2.00 • Na2O 4.38 61.99 .0707 .1414 .0707 .30 • Al2O3 7.21 101.963 .0707 .1414 x3/2.2121 .30 • MgO 13.30 40.312 .3299 .3299 .3299 .7 • CaO 18.46 55.96 .3299 .3299 .3299 .7 2.8278 • But pyroxenes here have 6 moles oxygens/mole, not 2.8278. Multiply moles cation by 6/2.8278 • As always, Moles Oxide = weight percentage divided by molec weight • Na .3 Ca.7 Al.3 Mg .7 Si2O6= 30% Jadeite 70% Diopside • http://www.science.uwaterloo.ca/~cchieh/cact/c120/formula.html This page checked Sept 2 2007 CLS
Phonolites have low to intermediate silica, but very high Alkali Na2O and K2O. They form from the partial melting of highly Aluminous (feldspar rich) rocks of the lower crust. Phonolite is the fine-grain equivalent of Nepheline Syenite Volcanics considerable glass, chemical analysis needed. For example, the Rhyolite had 72.82% SiO2 and total alkalis Na2O + K2O = 3.55 + 4.30 = 7.85% plots in the Rhyolite field of Figure 2.4 SEE NEXT SLIDE
Classification of Aphanitic Igneous Rocks Figure 2-4. A chemical classification of volcanics based on total alkalis vs. silica. After Le Bas et al. (1986) J. Petrol., 27, 745-750. Oxford University Press.Rhyolite had 72.82% SiO2 and total alkalis Na2O + K2O = 3.55 + 4.30 = 7.85%
Silica Undersaturation Incompatible Phases • Under magmatic conditions some minerals react with free silica to form other (more silica-rich) minerals. These reactant minerals are said to be undersaturated with respect to SiO2. • Typical reactions are: • 2SiO2 + NaAlSiO4 ==> NaAlSi3O8 quartz + nepheline ===> Albite • 2SiO2 + KAlSiO4 =======> KAlSi3O8 quartz + kalsilite =======> Orthoclase • SiO2 + Mg2SiO4 =======> 2MgSiO3 quartz + Mg-rich olivine ===> Enstatite
Silica Saturation-Undersaturation • Shand (1927) proposed the following list of minerals, subdivided on the basis of silica saturation and/or undersaturation, i.e. those that coexist with quartz (+Q) and those that do not coexist with quartz (-Q). • Undersaturated and saturated minerals can coexist stably under magmatic conditions, but quartz, tridymite and christobalite can only coexist stably with saturated minerals. For example Q + ne is an impossible igneous assemblage, as is Q + Fo (Mg – rich Ol) but Q + Fa (Fe- rich Ol) is stable.
CIPW Norm • Mode is the volume % of minerals seen • Norm is a calculated “idealized” mineralogy P135:”Because many volcanic Rocks are too fine-grained to recognize their mineral components, even microscopically, and many have a glassy component, a method was devised to calculate an idealized mineralogy for such rocks…by… Cross, Iddings, Pirsson, and Washington, called the CIPW norm.” “the step-by-step technique is described in …”. Appendix B.
CIPW Norm CIPW norms are so complicated they are best done by a program • The magma crystallizes under anhydrous conditions so that no hydrous minerals (Hornblende, Biotite) are formed. • The ferromagnesian minerals are assumed to be free of Al2O3. • The Fe/Mg ratio for all ferromagnesian minerals is assumed to be the same. • Several minerals are assumed to be incompatible, thus nepheline and/or olivine never appear with quartz in the norm. • This is, of course, an artificial set of constraints, and means that the results of the CIPW norm do not reflect the true course of igneous differentiation in nature.
CIPW Norm Cautions • A cumulate rock does not represent the melt from which it was extracted. However, if the groundmass of a cumulate can be analyzed, it is valid to use a normative calculation to gain information about the parental melt. • Oxidation state. If the Fe2+/Fe3+ ratio is known for the sample, the resulting calculation should match the observed mineralogy more closely. • Pressure and temperature. Because the CIPW Norm is based on anhydrous melts and crystallization at fairly low pressures, the resultant normative mineralogy does not reflect observed mineralogy for all rock types. Altered normative calculations have been developed that more correctly reflect the particular pressure regimes of the deep crust and mantle. • Carbon dioxide. The influence of CO2 in some cases, especially Carbonatite, and also certain lamprophyre type rocks, Kimberlite and Lamproite, the presence of carbon dioxide and calcite in the melt or accessory phases derives erroneous normative mineralogy. This is because if carbon is not analyzed, there is excess calcium, causing normative silica undersaturation, and increasing the calcium silicate mineral budget. Similarly, if graphite is present (as is the case with some Kimberlites) this can produce excess C, and hence skew the calculation toward excess carbonate. Excess elemental C also, in nature, results in reduced oxygen fugacity and alters Fe2+/Fe3+ ratios. • Mineral disequilibrium. It is improper to calculate normative mineralogy on an igneous breccia, for instance. • For this reason it is not advised to utilize a CIPW norm on Kimberlites, Lamproites, lamprophyres and some silica-undersaturated igneous rocks. In the case of Carbonatite, it is improper to use a CIPW norm upon a melt rich in carbonate.
Mt. Mazama (Crater Lake) Felsic magmas can result from the fractionation of intermediate magmas. Dissolved gasses occupy a much smaller volume than free gasses. • Mount Mazama is a destroyed stratovolcano in the Oregon part of the Cascade Volcanic Arc and the Cascade Range located in the United States. The volcano's collapsed caldera holds Crater Lake. It began erupting about 500,000 years ago. By about 30,000 years ago, Mount Mazama began to generate increasingly explosive eruptions that were followed by thick flows of silica-rich lava, an outward sign of the slow accumulation of a large volume of highly explosive magma deep beneath the volcano. • The cataclysmic eruption of Mount Mazama 7,700 years ago started from a single vent on the northeast side. So much magma erupted that the volcano began to collapse in on itself. As more magma was erupted, the collapse progressed until a caldera formed, 5 miles (8 km) in diameter and one mile (1.6 km) deep. Intermediate Silica, and especially Felsic magmas, have a lot of silica SiO2 and crystallize at low temperatures. Therefore they are very viscous, and cannot give up their dissolved volatiles when low surface pressures cause the volatiles to come out of solution
How do we display chemical data in a meaningful way? Variation Diagrams Mafic rx have Pyroxenes CaAl2Si2O8 then(K,Na)AlSi3O8 Bivariate diagrams Mafic rx have Pyroxenes Mafic rx have Anorthite Harker diagram for Crater Lake Felsic rx have Albite Felsic rx have K-spars K+ large, needs low Temps to fit in xtal. Figure 8-2. Harker variation diagram for 310 analyzed volcanic rocks from Crater Lake (Mt. Mazama), Oregon Cascades. Data compiled by Rick Conrey (personal communication).
http://minerva.union.edu/hollochk/skaergaard/introduction.htmhttp://minerva.union.edu/hollochk/skaergaard/introduction.htm Skaergård • The Skaergård intrusion is a layered igneous intrusion in East Greenland; it was important to the development of key concepts in igneous petrology, including magma differentiation, fractional crystallization, and the development of layering. The Skaergård intrusion formed when Tholeiitic magma was emplaced about 55 million years ago (boundary Paleocene and Eocene, PETM). The body is essentially a single pulse of magma, which crystallized from the bottom upward and the top downward. The intrusion is characterized by exceptionally well-developed cumulate crystal layers of Olivines, Pyroxenes, Plagioclases, and Magnetite.
http://minerva.union.edu/hollochk/skaergaard/introduction.htmhttp://minerva.union.edu/hollochk/skaergaard/introduction.htm Model for circulation and deposition within the Skaergaard intrusion (from Irvine et al., 1998). As the pluton lost heat to its upper crustal surroundings, it crystallized on its roof, floor, and walls. Accumulation was aided by the deposition of crystals from density-driven (convection!) currents. These deposits have a wide range of appearance depending on the location within the pluton and the level within the pluton. In addition, portions of the magma chamber roof periodically collapsed permitting roof zone autoliths and xenoliths to drop into the magma chamber and impact onto the floor. Much of our understanding of the roof zone comes from the autolith blocks, as most of the pluton roof has been eroded away and access to the rest is difficult. Skaergård
Table 8-5 . Chemical analyses (wt. %) of a hypothetical set of related volcanics. Oxide B BA A D RD R SiO 50.2 54.3 60.1 64.9 66.2 71.5 2 TiO 1.1 0.8 0.7 0.6 0.5 0.3 2 Al O 14.9 15.7 16.1 16.4 15.3 14.1 2 3 Fe O * 10.4 9.2 6.9 5.1 5.1 2.8 2 3 MgO 7.4 3.7 2.8 1.7 0.9 0.5 CaO 10.0 8.2 5.9 3.6 3.5 1.1 Na O 2.6 3.2 3.8 3.6 3.9 3.4 2 K O 1.0 2.1 2.5 2.5 3.1 4.1 2 LOI 1.9 2.0 1.8 1.6 1.2 1.4 Total 99.5 99.2 100.6 100.0 99.7 99.2 B = basalt, BA = basaltic andesite, A = andesite, D = dacite, RD = rhyo-dacite, R = rhyolite. Data from Ragland (1989) Models of Magmatic Evolution Dacite is a high Plagioclase, low alkali feldspar aphanitic rock with lower silica than Rhyolite LOI: Loss on ignition, a measure of hydration, e.g. OH- in hornblende If large magmas are initially basaltic, how do these differences occur?
Harker diagrams Oxide vs SiO2 • Smooth trends • 3 assumptions: 1 Rocks are related by Fractionation 2 Trends = liquid line of descent 3 Basalt is the parent magma from which the others are derived Figure 8-7. Stacked Harker diagrams for the calc-alkaline volcanic series of Table 8.5. From Ragland (1989). Basic Analytical Petrology, Oxford Univ. Press.
To get bulk, extrapolate BA B and further to low SiO2 • K2O is first element to zero (at SiO2 = 46.5) • Since the solid basalt probably had no K, 46.5% SiO2 is interpreted to be the concentration in the bulk SiO2 solid extract and the vert. blue line the concentration of all other oxides Figure 8-7. Stacked Harker diagrams for the calc-alkaline volcanic series of Table 8-5 (dark circles). From Ragland (1989). Basic Analytical Petrology, Oxford Univ. Press.
Cation Norms (Barth – Niggli) • An alternative norm calculation based on molecular proportions and cations • Uses the equivalent weights . In the case of CaO, the Equivalent Weight is the Molecular weight. In the case of Al2O3 or Na2O the equivalent weight is half the molecuar weight
Cation Norm Example • Wt% oxide values (col1) are divided by their equivalent weights (divide by col 2 and multiply by col 4), converted into cation proportions (col 5) and then converted into cation%. • Then CIPW rules except cations are allocated differently. In the case of CIPW norm the proportion of components allocated to Albite is Na/Al/Si = 1:1:6 on the basis of combined oxygen, whereas in Cation Norm the Albite allocation is 1:1:3 on the basis of cation proportions. • The cation norm is not recalculated on a wt% basis, rather the result is recalculated as a molecular percentage. http://www.amazon.com/Using-Geochemical-Data-Presentation-Interpretation/dp/0582067014/ref=sr_1_1?s=books&ie=UTF8&qid=1395072806&sr=1-1&keywords=Rollinson+Geochemical
Extrapolate the other curves back BA B blue line and read off X of oxide Then calculate a CIPW norm, or a cation norm, to give amts. plagioclases, pyroxenes, olivine, Fe-Ti oxides, etc. Symbols: an Albite, an Anorthite, di Diopside, hy Hypersthene (old name Opx, ss Enstatite to Ferrosilite) Olivine ol magnetite mt Ilmenite il (FeTiO3) Oxide Wt% Cation Norm SiO2 46.5 ab 18.3 TiO2 1.4 an 30.1 Al2O3 14.2 di 23.2 Fe2O3* 11.5 hy 4.7 MgO 10.8 ol 19.3 CaO 11.5 mt 1.7 Na2O 2.1 il 2.7 K2O 0 Total 98.1 100
Magma Series Can chemistry be used to distinguish families of magma types? Early on it was recognized that some chemical parameters were very useful in regard to distinguishing magmatic groups • Total Alkalis (Na2O + K2O) • Silica (SiO2) and silica saturation • Alumina (Al2O3)
Alkali vs. Silica diagram for Hawaiian volcanics: Seem to be two distinct groupings: alkaline and subalkaline Tholeiites and Calc-Alkaline Figure 8-11. Total alkalis vs. silica diagram for the alkaline and sub-alkaline rocks of Hawaii. After MacDonald (1968). GSA Memoir 116
Ne Volatile-free 3GPa 2GPa 1GPa Ab Highly undersaturated (nepheline-bearing) 1atm alkali olivine basalts Oversaturated (quartz-bearing) Undersaturated tholeiitic basalts tholeiitic basalts Fo En SiO2 Recall from last time, we plotted Tholeiitic versus Alkaline Basalts
The Basalt Tetrahedron and the Ne-Ol-Q base Alkaline and Subalkaline fields are again distinct Down here on the bottom plane Figure 8-12. Left: the basalt tetrahedron (after Yoder and Tilley, 1962). J. Pet., 3, 342-532. Right: the base of the basalt tetrahedron using cation normative minerals, with the compositions of subalkaline rocks (black) and alkaline rocks (yellow) from Figure 8-11, projected from the Cpx Diopside. After Irvine and Baragar (1971). Can. J. Earth Sci., 8, 523-548.
A Thermal divide separates the silica-saturated (subalkaline) from the silica-undersaturated (alkaline) fields at low pressure Cannot cross this divide, cooling liquids move away from the divide, so can’t derive one series from the other with fractionation. At high pressures the phase diagram is different, but that’s another topic, these are eruptions at the surface. 1713 Liquid Thermal Divide Tr + L Ne + L Ab + L Ab + L 1070 1060 Ne + Ab Ab + Tr Ne Ab Q Figure 8-13 SubAlkaline Field Alkaline Field
F o l h e T i i t i c Calc-alkaline M A AFM diagram: Tilley: can further subdivide the subalkaline magma series into a tholeiiticand a calc-alkaline series MORs and Plumes Figure 8-14. AFM diagram showing the distinction between selected tholeiitic rocks from Iceland, the Mid-Atlantic Ridge, the Columbia River Basalts, and Hawaii (solid circles) plus the calc-alkaline rocks of the Cascade volcanics (open circles). From Irving and Baragar (1971). After Irvine and Baragar (1971). Can. J. Earth Sci., 8, 523-548. Cascades above subduction zone
AFM diagram showing “typical” areas for various extents of evolution from primitive magma types. Tholeites go through a Ferro-Basalt stage before continuing towards Rhyolite.
A world-wide survey suggests that there may be some important differences between the three series * * http://petrology.oxfordjournals.org/content/39/6/1197.full.pdf Modified after Wilson (1989). Igneous Petrogenesis. Unwin Hyman - Kluwer