Download

1 / 8
80 likes | 207 Views
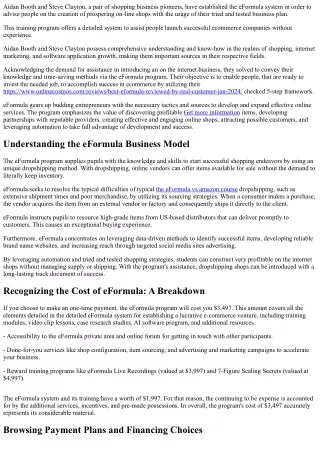
Feeva a Game Changer. % of Ad Spend Offline. XX%. XX%. XX%. XX%. TV, Print, OOH, Radio. DR TV, Local Marketing. Direct Response, Dir. Mail, Call to action. Foot traffic, in-store marketing. Buyers. Awareness Consideration Preference Action Layalty. Clients. Display,

E N D
Feeva a Game Changer % of Ad Spend Offline XX% XX% XX% XX% TV, Print, OOH, Radio DR TV, Local Marketing Direct Response, Dir. Mail, Call to action Foot traffic, in-store marketing Buyers Awareness Consideration Preference Action Layalty Clients Display, Rich Media CPA, Performance campaigns, Search, Email, BT, other targeting CPA, Performance campaigns, Search, Email, BT, other targeting XX% XX% XX% XX% % of Ad Spend On-line
Unbalanced Spending Users spend 29% of their time online, but only 8% of marketing dollars are spend online to reach them. “In typical week, how many hour do you spend doing each of following?” 32% Watching TV 37% ALLOCATION GAP Internet time (Including personal and work) 8% 29% 20% Newspapers 8% Percent of ad spending on each media type in 2007 Percent of total media time individuals spend with each media type in a typical week 6% Magazines 7% 9% Radio 19% Base: US adults Source: North American Technographics Benchmark Survey, 2007 *Consumer media time does not include time spent using a cell phone, watching DVDs, or playing video games 42463 Source: Forrester Research, Inc Why?......because major brand marketers rely on demographic data to buy every other medium, something that has not been solved for online audiences. 3
Intermediaries control bulk of display inventory and generate ~30% of revenue Average CPM Other* Display / rich media Premium/ Direct sales $12-18 Non- premium Seach Non- premium ~$1 Internet ad spend Share of impressions $ share of display market 4
Feeva derives segmentation from at zip +4 Age & Ethnicity Relationship/ Kids Financial Age Range 18-23 18-29 24-29 24-35 30-35 36-45 36-55 46-55 46-65 56-65 66+ 66-75 76+ Household Income UNDER $10,000 $10,000-$14,999 $15,000-$19,999 $20,000-$24,999 $25,000-$29,999 $30,000-$34,999 $35,000-$39,999 $40,000-$44,999 $45,000-$49,999 $50,000-$54,999 $55,000-$59,999 $60,000-$64,999 $65,000-$74,999 $75,000-$99,999 $100,000-$149,999 $150,000-$174,999 $175,000-$199,999 $200,000-$249,999 $250,000+ Net Worth <$100K $100K-$249K <$250K $250K-$999K <$500K $500K-$1MM $1-2MM $2MM+ Ethnicity AFRICAN AMERICAN ARAB ASIAN NON-ORIENTAL FRENCH GERMAN HISPANIC ITALIAN JEWISH MISC NORTHERN EUROPEAN POLYNESIAN SCOTTISH/IRISH SOUTHERN EUROPEAN Marital Status Married Married/Single Married/Single Parents Single Single Parent Single/Married Single/Married Parents Kids Kids; Age Mix No Kids School-age Kids Toddlers/Preschool Coming soon: Lifestyle, Health and others Urbanicity City & Surrounds Downtown Metro Rural Suburbs & Towns Home Ownership Owner Owner/Renter Renter Renter/Owner Ownership 5
Geo-demography: Accuracy and Reliability Geo-Segments: 1 1,000 500,000 City Postal code Postal code + 4 code 10001-10001 10001 10001-1002 City-XYZ 10002-1001 10002 10002-1002
Feeva derives demography from accurate geography Savvy Singles Age: 30-45 Rent /Own Home / No Kids Upper Middle Income Net Worth - <$250K Summit Estates Age: 36- 55 / Married Own Home / School Age Kids Wealthy Net Worth - $2MM + Apple Pie Age: 46- 65 / Married Own Home / School Age Kids Upper Middle Income Net Worth - <$500K Raising’ GrandKids Age: 66+ / Married / Single Own Home / School Age Kids Upper Middle Income Net Worth - <$500K
Specific Geographic and Demographic Data: The Problems we Solve Major Grocery Chain “We draw most of our customers from a 2-2.5 mile radius from a store.. The ability to effectively target just those locations would greatly enhance our online marketing activities” Top Ad Agency “ As the world moves digital… better, more accurate real-time data will always drive better campaigns.” Leading Insurance Company “We have over 75 offerings geared towards various, life-stages and income brackets. To date, no effective technology has allowed us to migrate from our traditional (off-line) marketing campaigns to the on-line world.” Major High-End Appliance Manufacture “We target the top 5% of the wealthiest Zips Codes, we simply cannot use online advertising (display), because the target accuracy does not exist” Yellow Pages Publisher “ The internet today is still very immature as it relates to local advertising, solid geographic targeting data, would be a game-changer for us (online).”