Download
1 / 13
130 likes | 248 Views
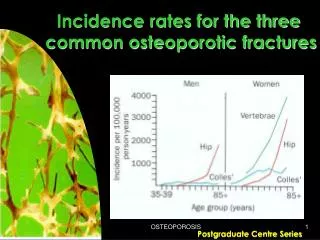
Incidence of childhood fractures in affluent and deprived areas. Ronan A Lyons. Background. Childhood injury mortality rates vary more between social groups than any other cause of death Many people assume that non-fatal injuries show the same pattern

E N D
Incidence of childhood fractures in affluent and deprived areas Ronan A Lyons
Background • Childhood injury mortality rates vary more between social groups than any other cause of death • Many people assume that non-fatal injuries show the same pattern • There is limited data on the distribution of non - fatal injuries
Injuries: Data Availability • Death Registeries • Hospital Admissions • Emergency Room Attendances • Primary Care Visits • Not brought to Medical Care: surveys
Socioeconomic Measures • Individual or Ecological Level • Education Level • Income: individual or household • Job Status: social class • Neighbourhood Wealth • Deprivation Scores
Townsend Index of Deprivation • Based on 4 questions in census every 10 years • Averaged area scores for : • Households with access to a car • Ovecrowding (>1 person per room) • Households owner occupied (not rented) • Unemployment Rate • Variables are Z scored and averaged
Study Design • All children with fractures attend 3 hospitals • Fracture rates do not decline with distance • Address used to define geographical area • Area divided into quartile of deprivation • Fracture rate calculated for each area • Crude and age standardised rates similar • Sub-analyses by cause of fracture
Results 1 • Townsend Scores in quartiles of population 6.3 0.7 -1.6 -4.4 • Population: 0-14 years 12150 14018 19924 22049 • Number of fractures 752 740 521 386
Fracture rates by Deprivation Quartile by Sports Activity (1)
Fracture rates by Deprivation Quartile by Sports Activity (2)
Ecological Study • Deprivation measured at area level • Comparison between areas not individuals • Results based on individuals may differ • Difficult to target deprived individuals • Easier to target deprived areas or schools • Prevention easier to focus on areas • Study based on non-fatal injuries
Fatal vs non fatal injuries • Motor vehicle accidents (MVAs) cause 35% childhood injury deaths in England + Wales • Only 1.4% of fractures due to MVAs • Therefore, epidemiology of fatal injuries differs to that of non-fatal injuries
Conclusions • Unlike fatal injuries, childhood fractures rates are similar in affluent and deprived areas • There is a tendancy for higher fracture rates from sports in more affluent areas • Fractures from assaults are more common in deprived areas