Download
1 / 14
140 likes | 513 Views
Purchasing Power Parity . and poverty comparisons Jed Friedman / Andrew Dabalen/ Ruslan Yemtsov . Relative poverty standard. EUROSTAT uses 60% of the median equivalized income as poverty line to calculate percentages of population at risk of financial poverty

E N D
Purchasing Power Parity and poverty comparisons Jed Friedman / Andrew Dabalen/ Ruslan Yemtsov
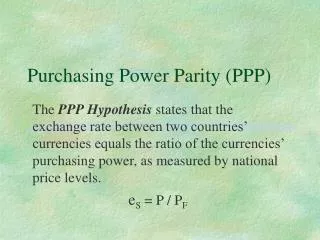
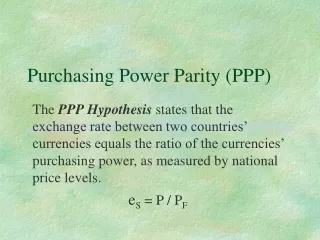
Relative poverty standard • EUROSTAT uses 60% of the median equivalized income as poverty line to calculate percentages of population at risk of financial poverty • Reporting in parallel the value of poverty threshold • Using PPP (or PPS) to correct for differences in the price level
Values of poverty line in Euros/year Purchasing Power Parities (PPP) or Purchasing Power Standards (PPS) PPPs are a fictitious currency exchange rate, which eliminate the impact of price level differences. Thus 1 PPS will buy a comparable basket of goods and services in each country. For ease of understanding they are scaled at EU level. In consequence the PPS can be thought of as the Euro in real terms.
To compare poverty, poverty line must be fixed • To compare poverty across countries poverty line must be the same • To derive international poverty line the World Bank uses the actual national poverty lines • Famous 1-dollar-a-day line is in fact $1.08 and this is the median value of national poverty lines in the 10 poorest countries of the world around 1990. • And converts them into international dollars using PPPs
Example from ECA • Which PPP s to take? • Global poverty counts are based on 1993 PPPs • In ECA 1993 data are very unreliable • More recent 2000 PPPs by EUROSTAT/CIS Stat comm. are more accurate • It has to be consumption PPPs if available • PPPs are primarily to compare output: the weights are the share of products in the economy’s output; there is a special sub-set called “consumption PPPs” • How to update PPPs to the year of comparison (survey year) • Price indices are used (CPIs), but they reflect price changes for “average” consumer, not for the poor. • To make them comparable to global poverty counts based on 1993 PPPs the year 2000 dollars have to be converted to 1993 international dollars
How PPPs look like? • FYR Macedonia 2003: • Exchange rate 52 Denars/$ • PPPs for GDP: 17.7 Denars/$ • Consumption PPPs 2000 (with update to 2003): 19.2 Denars/$ • PPPs 2000 expressed in US$ 1993: 22.93 Denars/ $
PPP revisions change poverty counts in ECA Note: Latest available year (2002 or 2003)
Limitations • (consumption) PPPs represent prices paid by the “average” consumer, as well as his/her structure of consumption, and not that of the poor • Many countries do not have recent PPPs • Esp Western Balkans: data only for Albania and Macedonia
Way forward • “Purchasing Power Parity Exchange Rates from Household Survey Data: India and Indonesia” by Angus Deaton, Jed Friedman, and Vivi Alatas (2004). In summary, this method takes observed unit-value data on comparable consumption items observed in each national survey to serve as multiple proxies for price observations. Large household surveys contain several million unit values, they are tied to actual transactions, and they are naturally linked to household characteristics such as income. In consequence, it is possible to calculate PPPs for different social groups, including PPPs for the poor.
Results: comparing poverty in India and Indonesia (1) • The market exchange rate between Indian Rupee and Indonesian Rupiah in 1999 averaged 182 Indonesian Rupiah per Indian Rupee • The Penn World Table PPPs between India and Indonesia for 1999 was 165 • The estimated consumption PPPs based on unit values averaged 230 • The PPPs for the rural poor was 238, very close to the overall PPP
Results: comparing poverty in India and Indonesia (2) • These results imply either Indian households are better-off or Indonesian households are worse-off (or both) than standard PPPs suggest • The same is true for the poor: there is less poor in India relative to Indonesia (in relation to standard PPPs or nominal exchange) • Why the difference? One culprit appears to be official Indonesian CPI, which places very little weight on food in relation to average consumption – and Indonesian relative price of food increased substantially over 1997 crisis
Work on Western Balkans • By 2007 PPPs from the recent round of ICP (but again not universal coverage) • In parallel research program to use surveys for the comparison