Download
1 / 45
450 likes | 851 Views
24 Month Reliability Outlook. Stakeholder Information Session Tuesday, January 19, 2010 Jerry Mossing and Steve Heidt. System Operations Direct the reliable operation of Alberta’s power grid Markets

E N D
24 Month Reliability Outlook Stakeholder Information Session Tuesday, January 19, 2010 Jerry Mossing and Steve Heidt
System Operations Direct the reliable operation of Alberta’s power grid Markets Develop and operate Alberta’s real-time wholesale energy market to facilitate fair, efficient and open competition Transmission System Development Plan and develop Alberta’s transmission system to ensure continued reliability and facilitate the competitive market and investment in new supply Transmission System Access Provide system access for both generation and load customers Role of Alberta Electric System Operator (AESO)
24 Month Reliability Outlook • Provides a comprehensive assessment of the reliability of the electric system • Include details on each area, the area’s transfer limits, and how the area will be operated for the next couple of years • Include transmission upgrades expected to be in service in the next 2 years • Stakeholders have a common understanding of transmission operating issues, short term load growth, and supply outlook
Agenda • Load Forecast • Supply Adequacy • Demand Response • Import / Export capability • Reliability • Operations Planning studies • Regional and Area overview and performance • Transmission Development - 2009 to 2011 • Summary
Load Forecast • In the long term Alberta is positioned for strong economic growth resulting in strong load growth • Recession – set the clock back at least one year • Actual rate of growth has been lower • Actual peak loads are dependant on both temperature and the actions of price sensitive loads (175 – 300 MW) • Total wind generation output at any given time impacts the System Marginal Price
Supply Adequacy • AESO performs a number of assessments on supply adequacy • Daily and weekly • Short term to year end • Long term to five year • Summary of New Generation Development Projects • Based on Long Term Adequacy Metrics - November 2009 • Projects with Estimated in service date before November 2011 • Posted at www.aeso.ca Market Participant Information Market & Systems Reporting Long Term Adequacy Metrics – November 2009
Demand Response • Approximately 175 to 300 MW of load participate in the market in response to pool price • Loads are also provided the opportunity to participate in the Operating Reserves market as supplemental reserves • AESO contracts for load shed services for frequency support (LSS) • The AESO offers a Demand Opportunity Service (DOS) rate for transmission customers • The AESO is currently working with stakeholders to • enable and encourage load to participate in Alberta’s electricity markets and • look at voluntary demand response to assist system reliability over the next number of years in a manner consistent with legislation and regulation
Alberta Import Capability • BC to Alberta • WECC Path 1 • One 500 kV and two 138 kV lines • Current capability 780 MW • Require load shed programs to support high levels of import • Design and use of load shed programs are being reviewed • OPP 304 & OPP 312 • Saskatchewan to Alberta • WECC Path 2 • Back to back AC/DC Converter at McNeil • Current capability is 150 MW • OPP 307 • MATL (Montana to Alberta) • 300 MW capability
Alberta Export Capability • Alberta to BC • Current capability 800 MW • Available and utilized during off peak hours • OPP 304 • Alberta to Saskatchewan • Designed for 150 MW, current capability is limited to 35 MW • Plan to restore to 75 MW in 2010 Q1 and 150 MW in 2010 Q3 • New Cypress substation and reconfiguring of 138 & 240 kV lines • OPP 307 • MATL (Montana to Alberta) • 300 MW capability
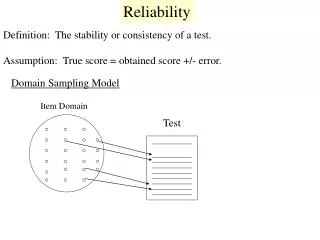
What is an adequate level of reliability? “The System • is controlled to stay within acceptable limits during normal conditions • performs acceptably after credible Contingencies • limits the impact and scope of instability and Cascading Outages when they occur • facilities are protected from unacceptable damage by operating them within Facility Ratings • integrity can be restored promptly if it is lost, and • has the ability to supply the aggregate electric power and energy requirements of the electricity consumers at all times, taking into account scheduled and reasonably expected unscheduled outages of system components”
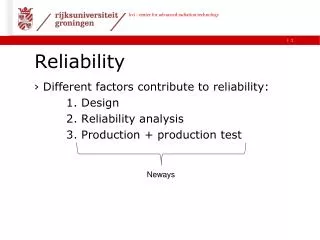
Operation PlanningStudy Methodology • Each Region or Area is analyzed and studied considering • Current system (including known system additions) • Low and High loading levels • Low and High generation levels • Select Contingencies to be studied • Single Circuit, Common tower circuit, Bus outages, Breaker fail • Study objectives • Determine the operating limits of the system • Look for constraints for the study period • Performance criteria (applied in system normal and following contingency situations) • Thermal Limit – equipment normal or emergency rating are exceeded • Voltage Limit – bus voltage level or deviation is outside acceptable limits • Voltage Stability Limit – area solves without required voltage support margin • Angular Stability Limit – area solves in an unstable or oscillatory state
Preparing for Next Contingency System in Normal state must sustain next contingency and meet the performance criteria, not just operate within limits in normal state Normal State (Prepared System) Meets Performance Criteria Contingency Prepare System for Next contingency SystemReady for Next Contingency Meets Performance Criteria Contingency
Weekly Coordination Plan • TFOs and GFOs are required to submit planned outages to the AESO • The AESO analyzes proposed outages • The AESO approves transmission outages and consults with owners where issues arise • Approved transmission outages are published on our website • On a week ahead basis, AESO performs operational studies considering • outage schedules for each day • short term load forecast and known generation status • The objective is to identify SOL violations and implement necessary procedures • In consultation with TFOs, AESO develops procedures for the real time operators to manage constraints as required • Generator Outage Cancellation Rule
Overview & Revisions • Total Generation: 12,623 MW (CSD page Oct 27) • Load numbers based on FC2009 Long Term forecast for Winter 2009/10 • Average values are reported for 2008 to end of October 2009 Revisions to 2008 Presentation/Report: • NE load: 2100 MW (last presentation) corrected to 1,640 MW this year • NE generation 2482 MW (last presentation) should have been 2,144 MW
Northeast Region • Region Load approximately = 1,640 MW • 17% of peak load • Region Generation = 2,441 MW • 18% of Alberta Generation, up from 2,144 MW last year • Significant industrial load and base loaded co-generation • Expect significant growth in both generation and load over the long term • Comprises three areas
Northeast RegionFort McMurray Area • Area Load approximately = 1,199 MW • 12% of peak load • 90+ MW - Fort McMurray City load, +15% growth expected each year for next two years • Area Generation = 1,779 MW • Three 240 kV lines define the FMM cutplane and the transfer limit is 600 MW (out) and 300 MW (in) • Typically MW flow is out of the area • Maximum transfer-out in 2008/2009 was 577 MW, transfer-in was 144 MW • With one line out of service transfer capability is reduced • Actual congestion – twice in 2008 and seven times in 2009 • 7.4% of the time, maximum transfer capability is reduced to below stated 600 / 300 MW limits (i.e.; one element out of service) • The 144 kV system Ruth Lake to McMillan is thermally and voltage constrained especially during outages • OPP 505 • Location of new load in the area may reduce the transfer-in capability
Northeast RegionAthabasca & Lac La Biche Area • Area Load approximately = 131 MW • 1.3% of peak load • Area Generation = 117 MW • Typical MW flow is into the area • Area is voltage limited • Congestion may show up when operating under single element outage and is dependent on the area load • Planned outages managed via weekly coordination plans
Northeast RegionCold Lake Area • Area Load approximately = 310 MW • 3.1% of peak load • Area Generation = 345 MW • Typical MW flow is out of the area • During light load periods the Cold Lake area is thermally constrained during outage conditions • RAS are applied to alleviate transmission line overloads following contingencies by running back and or tripping area generation • Expected load and generation increase in the area relating to heavy oil facilities • OPP 508
Northwest Region • Region Load approximately = 1,102 MW • 11% of peak load • Region Generation = 770 MW • 6.1% of installed capacity, up from 695 MW last year • Three 240 kV lines connect Wabamun Lake to the Northwest • Typical MW flow into the area ranges from 530 to 755 MW • Area Limitations: • Voltage stability, angular stability and thermally constrained area • Region is very dependant on local generation to supply load • Area can accommodate generation additions
Northwest RegionNorthwest Area (excluding Rainbow) • Area Load approximately = 963 MW • 9.7% of peak load • Area Generation = 452 MW • Transmission flow into the area • ranges from 300 to 500 MW (NW cutplane definition) • Current system does not have capacity to support all area load, without local generation on line • TMR is needed 50% of the time • Area is voltage stability, angular stability limited and thermally limited • Studies complete, result is to introduce new Northwest cutplane inflow limit • NPP1 generation connected (93 MW) • No new generation to be connected in next 2 years • New 60 MVAr of cap banks added to the region (Lubicon) in 2009 • New +/- 30 MVAr SVC energized at Cranberry Lake in 2009 • 240 kV transmission line energized in December • New +/- 100 MVAr SVC to be energized at Little Smoky in March 2010 • OPP 501
Northwest RegionRainbow Area • Area Load approximately = 139 MW • 1.4% of peak load • Area Generation = 228 MW • Interconnected through one 144 kV transmission line • Current system does not have capacity to support all area load • Area is voltage stability limited • Area interchange flows into the area range from 0 – 13 MW • Requires minimum Rainbow area generation on-line 100% of the time • Load is shed for multiple Rainbow area generation contingencies • New 73 MW Fort Nelson Generation expected in 2011 • New 30 MW biomass generator in High Level area in 2011 • New Meikle substation & 2x 144kV lines into Rainbow Area in 2011 • New 144kV line High Level to Sulphur Point in 2011 • New SVC at High Level substation in 2010 • OPP 501
Edmonton Region • Region Load approximately = 2,557 MW • 26% of peak load • Region Generation = 5,286 MW (42% of installed capacity) • Transmission system • Four 240 kV lines from Sundance plants to Edmonton area • Two 500 kV and one 240 kV from KEG to Edmonton area • Several 240 kV and 138 kV between Edmonton & Ft Sask • Largest flows west to east and south • Bulk system is approaching capacity limit • Limits are based on thermal, angular and voltage stability • Wabamun 4 to be decommissioned March 2010 (279 MW) • Keephills 3 (450 MW) require new transmission developments
Edmonton Region Keephills / Ellerslie / Genesee (KEG) • 4,104 MW of base loaded coal generation • Keephills Plant (762 MW) • Genesee Plant (1,218 MW) • Sundance Plant (2,124 MW) • Transmission • Two 500 kV and one 240 kV from KEG to Edmonton area • Two 240 kV between Keephills & Benalto • Flows east to Ellerslie and south to Benalto • Transmission system operating at it’s limit • A line outage requires significant generation curtailment • Limits are based on thermal, angular and voltage stability • Generation constrained during construction of 500 kV conversion and twice during line outages • Third 240 kV line to be converted to 500 kV in May 2010 • OPP 517
Edmonton Region City of Edmonton Area • Area Load approximately = 1,790 MW • 18% of peak load • Area Generation = 289 MW • Rossdale plant decommissioned(209 MW) in 2009 • New Clover Bar units in 2009 (#2 and #3) • Typical flows into the area from Wabamun Lake and Northeast • 947L 240 kV line termination from Ellerslie to Clover Bar to be completed in mid-2010
Edmonton Region 138 kV system around Edmonton • Area Load approximately = 143 MW • 1.4% of peak load • Area interchange flow into area (no generation in area) • East Edmonton to Nisku to Wabamun to North Calder 138 kV system is voltage and thermally constrained during outages • Planned outages are managed via weekly coordination plans • Transmission reinforcements are necessary
Edmonton Region Fort Saskatchewan Area • Area Load 454 MW • 4.6% of peak load • Area Generation 614 MW • Significant industrial load and base loaded co-generation • Typical flows are into the area and ranges from 80 to 225 MW • Region is dependant on base loaded local generation to supply load • Area can accommodate new generation • AESO has applied for upgrades to supply load growth and new load additions • New transmission will address bulk system future constraints
North - South Bulk Transmission(Edmonton to Calgary) • Six 240 kV lines • Wabamun Lake / Edmonton area to Red Deer area • Red Deer area to Calgary area • Transfer limits (Operational Definition): • Summer = 2,050 MW • Winter = 2,150 MW • Limitation angular stability and thermal (138 kV overloads) • Flows • Always North to South • 2,010 MW maximum flow (68 MW minimum, 1160 MW average) • 7.1% of the time available transfer limit was reduced • Congestion triggered three times in 2007, once in 2008 and once this year (to Sept 30) • OPP 521
Central Region • The region covers a large area south of Edmonton, North of Calgary bordered by BC and Saskatchewan. • Region Load approximately = 1,590 MW • 16% of peak load • Region Generation = 1705 MW • 14% of installed capacity • 30% of the energy consumption comes from other areas
Central RegionBenalto West - Red Deer Area • Area Load = 137 MW • 1.4% of peak load • Area generation = 139 MW • Transmission system in all areas is thermally and voltage constrained when operating under single element outage • 18% of the time there was one element out of service • Constraints managed by weekly coordination plan
Central RegionJoffre Area and Red Deer • Area Load = 500 MW • 5.0% of peak load • Area Generation = 474 MW • Significant industrial load and base loaded co-generation • Area interchange flows depends on generation status • Thermally limited for outflow and voltage for inflow • Established in flow and out flow limits • Dependant on base loaded local generation to supply area load – area is monitored but not encroaching area limit • OPP 502
Central RegionBrazeau and East Central • Brazeau area 138 kV system • 428 MW of generation, 290 MW of load • Voltage limited during outage depending on load • 8.3% of the time the area has one line out of service • East Central • 664 MW of generation and 664 MW load - 6.7% of peak load. • Metiskow / Lloydminster / Bonnyville / Vermillion / Hanna • Large geographic area that is has weak transmission support • Voltage and thermal limitations during single element outage • Experiencing future load growth relating to new pipeline operations • Expect new 240 kV connections to Hardisty area and south of Monitor in the Hanna area to provide area reinforcement • Both areas are being managed through the weekly coordination plans
Calgary Region • Region Load = 2,064 MW • 21% of peak load • Region Generation = 935 MW • 7.4% of installed capacity • Typically MW flow is into the area • SOK – North to South • Bow • Into Bow area at night • Out from Bow area during the day • South • Wind blowing – flow is South to North • No Wind – North to South • System limits managed through specific limits • Path 1 limits • SOK limits • Dynamic VAr requirements and monitoring • Under Voltage Load Shedding scheme
Calgary RegionCalgary Area • Area Load = 1,765 MW • Calgary, Strathmore and Airdrie • 18% of peak load • Area Generation = 616 MW • Calpine, Balzac, Cavalier, Carseland, Summit/Crossfield • Downtown core and south is thermally constrained • With one line out of service, next contingency results in controlled loss of load • AESO and ENMAX are creating development plans in the short and long terms to address area reliability concerns
Calgary RegionBow Area & South of Calgary • Bow area • Area Load approximately 190 MW • 1.9% of peak load • Area Generation = 319 MW • Transmission connected with three 138 kV line to Calgary and one 138 kV line to BC (NATAL) • 138 kV system to the west is thermally constrained, depends on amount of hydro generation on-line • South of Calgary • 109 MW load • 1.1% of peak, no generation • 138 kV system east and south of Calgary is thermally and voltage constrained when operating with one line out of service
South Region • Region Load = 945 MW • 9.5% of peak load • Region Generation = 1,685 MW (13% of installed capacity) • Three 240 kV lines from the Calgary region and three from Sheerness • Typical flow depends on Sheerness status • The current bulk system is approaching its capacity • Require substantial reinforcement for transfer of wind generation • New facilities • Cypress Substation – December 2009 • 240 kV in southwest expected in 2010 • Capacitor banks at McNeil substation in 2010 • Southern Alberta Transmission Reinforcement
South RegionSouthwest Area • Area Load = 113 MW (Lethbridge not included) • 1.1% of provincial peak load • Area Generation = 534 MW • Flow is out of the area but is dependant on wind generation • Area generation is constrained due to the delay in transmission upgrades • Thermally limited area • Dynamic Thermal Line Rating pilot project completed • Overall positive impact to line rating • OPP 515 • Congestion events • 2007: 24 events; 2008: 89 events; 2009 (to end of Oct): 69 events • SW 240 kV project will address most current issues
South RegionSoutheast Area • Area Load = 832 MW • 8.4% of provincial peak load • Area Generation = 1,151 MW • Transmission consists of • Two 240 kV three terminal lines • One 240 kV line heading north of Sheerness • Typical flow into the area • The area is thermally, voltage limited, and angular stability limited • Studies complete to introduce a new Southeast cutplane on the three 240 kV lines south of Anderson substation
South RegionSoutheast Area (Cont.) • Congestion • 2007: 0 events, 0 hours • 2008: 28 events, 501.3 hours • To end of October 2009: 23 events, 156.8 hours • Area Developments • New development in 2010 will mitigate reliability concerns in the Empress area and interconnection to Saskatchewan • Transformer replacements at West Brooks and North Lethbridge will address thermal constraints • AESO Planning is developing a NID to facilitate wind generation interconnections and remove single contingency constraints
System OverviewCurrent Operation • With all elements in service, current system has the capacity to meet the AESO Operating Criteria requirements except the following local areas: • Loss of a short 138 kV line in Empress area may cause load loss • 72 kV system in NW is thermally and voltage constrained • 144 kV system in Fort McMurray area voltage constrained • 240 kV double circuit tower failure NW / NE / SE • SW transmission line overloads during high wind generation • 138 kV system South of Calgary, downtown underground cables • AESO is developing plans to address these local area concerns • AESO actively manages planned outages via weekly coordination plan
2009 - Major Upgrades • 240 kV line into the Northwest • Capacitor banks in Northwest • Langdon SVC rebuild • Cypress substation • McNeil converter control system upgrade • 240/138 kV transformer capacity increase at West Brooks
Major New Transmission Projects expected 2010 – 2011 • Southwest Development - 240 kV transmission lines • Several capacitor banks and SVCs in the Northwest • 144 kV lines in Northwest • KEG area upgrades • The Montana Alberta tie line • Re-termination of 947L between Ellerslie 89s and Clover Bar 987s • The 240/138 kV transformer addition at North Lethbridge • Transmission additions and re-configurations in the City of Calgary • Southwest transmission upgrades – Coleman Phase Shifting transformer • McNeil Converter station – restore to 150 MW export to Saskatchewan • Empress Area Capacitor Banks
Overall Summary • The system is reliable, however, constraints to generation and loads are expected to occur, particularly when elements are out of service due to planned and forced outages • Need to maintain emphasis on system analysis, operating procedures, tools, and training to preserve reliability and manage constraints as they occur