Download
1 / 33
330 likes | 493 Views
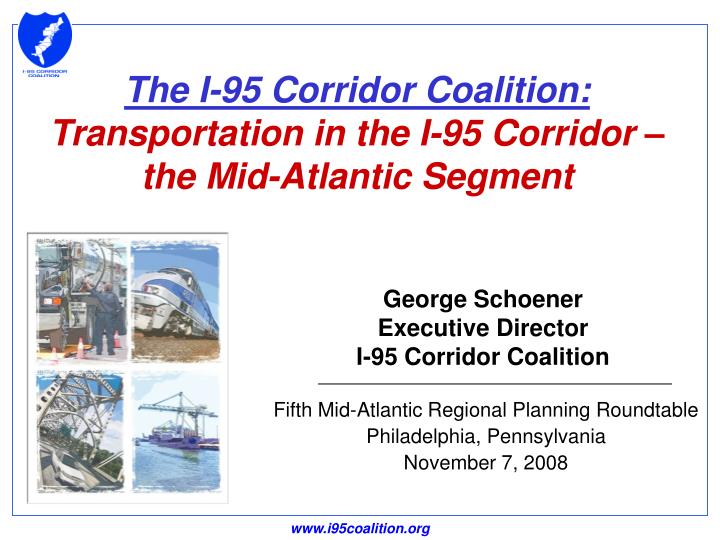
George Schoener Executive Director I-95 Corridor Coalition. The I-95 Corridor Coalition: Transportation in the I-95 Corridor – the Mid-Atlantic Segment. Fifth Mid-Atlantic Regional Planning Roundtable Philadelphia, Pennsylvania November 7, 2008. I-95 Corridor Coalition. The Coalition:

E N D
George Schoener Executive DirectorI-95 Corridor Coalition The I-95 Corridor Coalition:Transportation in the I-95 Corridor – the Mid-Atlantic Segment Fifth Mid-Atlantic Regional Planning Roundtable Philadelphia, Pennsylvania November 7, 2008
I-95 Corridor Coalition • The Coalition: • An alliance of transportation agencies, toll authorities and related organizations, working together to accelerate improvements in long-distance freight movement and passenger travel. • The Region: • 40,000 National Highway System Miles • 22,000 miles of Class I rail mileage • 46 major seaports • 103 commercial airports • The Economy: • $4.5 trillion economy (40% of US GDP) • 5.3 billion tons of freight shipments annually • 21% of nation’s road miles (35% of VMT)
The I-95 Region has:42 of Top 100 Metropolitan Areas by GDP 6 of Top 10 Metropolitan Areas Seattle (15) $182,170,000 Minneapolis (14) $171,361,000 St. Louis (17) $116,215,000 Chicago (3) $461,374,000 Detroit (12) $198,630,000 Boston (8) $261,086,000 New York (1) $1,056,381,000 Philadelphia (6) $295,236,000 Baltimore (18) $118,063,000 San Francisco (11) $268,300,000 Washington, DC (4) $347,631,000 Los Angeles (2) $632,407,000 Atlanta (10) $242,382,000 Tampa (20) $100,952,000 San Diego (16) $146,341,000 Riverside (19) $101,561,000 Phoenix (13) $160,028,000 Miami (7) $231,806,000 Dallas (5) $315,544,000 Houston (9) $316,332,000 Source: MetroNation: How U.S. Metropolitan Areas Fuel American Prosperity. Metropolitan Policy Program at Brookings.
Addressing Issues Within & Between Mega-Regions: Developing a Long-Range Transportation Strategic Vision for the Corridor Transportation Vision 2040: Supporting Economic Growth in a Carbon-Constrained Environment
Transportation Vision 2040 • Consequences of “Business as Usual” • 2040 Vision Principles • What Will It Take to Achieve the Vision? • What Will It Cost?
Continuing a “Business as Usual” Approach to Transportation Will Lead to Dire Consequences • Continuing existing trends in vehicle-miles-traveled (VMT) and in investment levels results in the following in 2040: • 70% increase in VMT • Dramatic increases in congestion levels • 84% delay increase on urban Interstate • 49% all systems • Doubling of freight carried on trucks • Loss of mode share by freight rail and marine shipping • 34% increase in fuel consumption and greenhouse gas (GHG) emissions (in spite of more stringent fuel efficiency standards) Business as Usual
Many Major Highways Along the East Coast Will be Completely Clogged in Peak Periods Business as Usual
Cost of Goods Will Increase with the Doubling of Truck Freight Movement Along Congested Highways Business as Usual
Large Growth in Travel Will Lead to Increased Greenhouse Gas Emissions 2007 EISA Café Improvements Business as Usual
A Better Way: A Strategic Vision for Transportation in the Region in 2040 Significant Change Is Needed to Support Continuing Economic Growth in a Carbon Constrained Environment 2040 Vision
“Make no little plans; they have no magic to stir men’s blood.” Daniel Burnham, 1893 2040 Vision
A Set of Consensus Policy Principles Guided Development of the Vision • Support Continuing Economic Growth • Support Sustainable Environmental and Energy Policies • Support Sustainable Land Use Practices • Provide a Balanced MultimodalTransportation System 2040 Vision
Coalition’s Strategic Vision Builds on Results from Nationally-Prominent and State/Regional Visioning Efforts National Surface Transportation Policy and Revenue Commission State/Local Vision Efforts MPO Intake Session AASHTO-Led Vision for 21st Century Other Literature I-95 Strategic Vision Best Information & Expertise Available 2040 Vision
What Will It Take to Achieve the Vision? • Increased Vehicle Fuel Efficiency • Increased Use of Alternative Fuels • Reduced Rate of VMT Growth • Greater use of Alternative Modes • Aggressive Transportation System Management • Including Pricing and VII • Additional Highway Capacity • Especially Managed Lanes Achieving the Vision
A Multimodal Transportation System Enables Greater Use of Non-Highway Modes • Transit ridership is tripled in concert with transit oriented development • Passenger rail ridership increases 8-fold; reduces aviation and highway congestion • Freight rail ton miles increase 20% • A marine highway network and reduces the number of trucks on the region’s highways • Improved port access enhances intermodal connectivity Achieving the Vision
Additional Highway Capacity is Needed to Improved System Performance • 15,000 additional interstate lane miles will be required throughout the region • Much of which will be managed lanes • An array of highway system improvements will complement the additional capacity: • Major reconstruction of aging infrastructure • Bottleneck elimination Achieving the Vision
A 60-80% Reduction in 2005 Greenhouse Gas Emission Levels Will Be Achieved Achieving the Vision
More than Doubling of Investment in all Modes is Needed *includes intermodal connections to ports, airports, rail terminals The Cost
We Will Transition to a New Financing Model Other State/Local Fee Options Environmental Fee (Carbon Pricing) Congestion Fee Base VMT Fee (to Replace Gas Tax) The Cost
Addressing Issues Within & Between Mega-Regions: Developing a Plan to Address Rail Choke Points in the Mid-Atlantic Region
Mid-Atlantic Rail Operations Study, Phase I (MAROps I) • Participants • CSX, NS, and Amtrak • NJ, PA, DE, MD, and VA • I-95 Corridor Coalition • U.S. DOT/FHWA and FRA • Process • Bottoms up look at the regional rail system • Identified critical rail choke points; driven by railroad and state planning and rail operations experts • Identified improvements needed from system perspective • Developed strategic, phased program
MAROps I Program The MAROps Study identified 71 major rail choke points requiring $6.2 billion in improvements over 20 years Source: Cambridge Systematics, Mid-Atlantic Rail Operations Study.
Rail, Bridge, and Tunnel Choke Points Identified chokepoints by type and estimated cost to mitigate
Near-Term, Five-Year Program, $2.4 Billion Organized projects into three five-year programs based on contribution to system performance, lead time required, and cost
Mid-Atlantic Rail Operations Study, Phase II (MAROps II) • Participants • Same plus New York State • Process • Update condition and performance of rail and highway networks (supply) • Examine commodity flows and supply chains (demand) • Update MAROps program • Estimate MAROps program benefits • Develop transferable institutional mechanisms for implementing regional rail programs
Mid-Atlantic Truck Operations (MATOps) Study Compile List of Bottlenecks from Available Data Sources
Addressing Issues Within & Between Mega-Regions: Developing an Information Network that Covers the Entire Region
Integrated Corridor Analysis Tool (ICAT) Highway Network ICAT is a GIS-based, multi-state highway network that covers the entire Coalition region
Created from individual state DOT road networks Standardized attributes Links to National datasets ICAT Highway Network
Challenges of Planning Within & Between Mega-Regions: • Institutional • Existing Structure: State/MPO • Challenges of dealing with operations, technology, financing, climate change, public-private partnerships, etc. • Emerging Focus: Multi-State • Cooperation within and between mega-regions • I-95 Corridor Coalition Provides One Model • Funding, Financing, Data