Download
1 / 21
210 likes | 354 Views
This research was sponsored by NASA Langley Research Center under Grant No. NNL06AA21A. The opinions and conclusions expressed in this presentation are those of the authors and do not necessarily reflect the views of NASA. Psychophysical Modeling of Perceived Clutter in Advanced Head-Up Displays.

E N D
This research was sponsored by NASA Langley Research Center under Grant No. NNL06AA21A. The opinions and conclusions expressed in this presentation are those of the authors and do not necessarily reflect the views of NASA. Psychophysical Modeling of Perceived Clutter in Advanced Head-Up Displays Amy L. Alexander Emily M. Stelzer Aptima, Inc., Woburn, MA, USA David B. Kaber Simon M. Hsiang Sang-Hwan Kim Edward P. Fitts Department of Industrial & Systems Engineering, North Carolina State University, Raleigh, NC, USA NASA Aviation Safety Technical Conference, St. Louis, Missouri, October 10-12, 2007
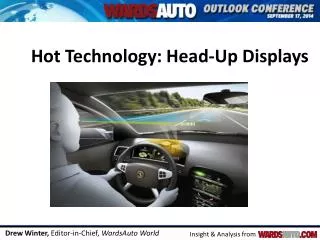
Introduction New air/ground display technologies are being developed to acheive NGATS (NextGen) objectives. Example - E/SVS HUDs for supporting pilot SA and reducing workload under critical flight conditions. • Characteristics: • Provide pilots with “clear” view of environment • Terrain model (non-iconic info) presented as background to PFD, ND, or HUD symbology • HUD objectives: • Minimize pilot hazardous states of awareness • Reduce pilot errors in low-visibility conditions
Current Issues • Potential for pilot information overload under high workload conditions. • Combination of non-iconic and iconic features leads to high visual density (not necessarily high information density). • Pilots may perceive E/SVS HUDs to be cluttered - additional icons, terrain models, navigation guidance symbology. • Pilots observed dissociation rather than integration of flight guidance info with aircraft status in HUDs. Led to perceptions of clutter. • HUD designs, incorporating iconic and non-iconic imagery, should provide pilots with complete flight status info while minimizing clutter. • E/SVS HUDs need to consider pilot information processing capacity to prevent performance problems (increased visual search time and errors). Russell & Everett, 2005 Merrick et al., 1990
Previous Research and Potential Solutions Limitations of previous research: No commonly accepted definition of display clutter. Existing measures only defined in terms of one or two physical display characteristics: Target-to-background contrast Local display density Feature size and grouping Salience of features (color, luminance) Research needs… Further define construct of display “clutter”. Develop multidimensional measures of clutter - subjective and objective. Develop model of clutter and relate output to pilot performance measures (establish “clutter thresholds”). Meitzler et al., 1997 Aviram & Rotman, 2000 Ewing et al., 2006; Rotman et al., 1994 Muthard & Wickens, 2005 Rosenholtz et al., 2005
Objectives of Current Research • Overarching goal is to develop multi-dimensional measure of display clutter to evaluate air/ground display technologies for NextGen. (Understand relation of physical display features to perceived dimensions of clutter.) • Selected E/SVS HUD as application - NextGen enabling tech. • First-year project: • assess pilot perceptions of clutter in E/SVS HUDs • determine how pilots characterize HUD clutter using ratings of pairs of descriptor terms • identify underlying perceptual qualities of clutter • Expected outcome (first-year) - Perceptual decomposition of clutter.
Study of influence of major HUD information elements on perceived clutter: SVS - Monochrome, wire-frame terrain model (“ON”/“OFF”) EVS - Monochrome FLIR returns (ON/OFF) TCAS - Traffic collision avoidance system info (ON/OFF) Flight pathway guidance - TUNNEL (ON/OFF) HUD Symbology (IMC/PRIMARY) (Total number of combinations = 32) Empirical Investigation - Conditions Full-featured HUD What is the effect of adding or subtracting features on perceived clutter? Wire-frame of terrain Thermal imagery Traffic icons Tunnel on Primary mode
Flight Scenario Standard ILS RWY 16R approach at KRNO: Realistic IMC approach known to many pilots. Terrain features motivated use of E/SVS and TUNNEL. Normally flown under worst weather conditions. Realistic pacing of aircraft speed, configuration and altitude changes. Presented 16 different static HUD images at specific points in approach: Aircraft status, pathway guidance, terrain features. Symbology like HDD PFD. Low ceiling (1100 AFL) and visibility. Scenario read to pilots by SME - Provided context for clutter ratings (e.g., high visual density, low info content). Used Keller et al. (2003) CTA as template.
Experimental Design and Procedures • Used fractional factorial design (limited sample - n=4): • 25-1 Resolution V - ½ replicate design for 5 factors with 16 runs. (Can only assess main effects and two-way interactions. Three- and four-way interactions are confounded.) • 4 hr. sessions with each pilot, including 4 runs. • 16 images in each run ranging from basic, “decluttered” IMC HUD to “full-featured display” (everything ON). • SVS images were concentrated in initial approach • EVS HUD images concentrated in final stage of approach • Same images in each trial. • Variations in runs: • Weather conditions • Airfield advisories • Minor deviations off course Montgomery, 1991
Test Subjects • Four expert test pilots (recruited by NASA). • Prior experience in flying commercial transport. • Familiarity with advanced HUD technology (E/SVS) • Three males and one female (27-59 yrs.) • Flight hours - 1300-9000 • 2-of-4 had flown with SVS display • 1-of-4 had flown with EVS display
Pilot ratings of “overall clutter” (0-20) for each image in flight scenario. Pilot ranking of 14 pairs of terms for relevance in describing display clutter. (Terms identified through: review of literature on measures of clutter; and semantic analysis using concept-relevant terms.) Pilot rating of utility of pairs of terms for describing each HUD. “Low” - Little applicability in describing display. “High” - Terms are highly useful for describing display. Dependent Variables Ahlstrom, 2005 Rosenholtz et al., 2005 Ververs & Wickens, 1998 Wang et al., 2001 Tullis, 1997 Once at start of study and once at end. Wang et al., 2001 Beijer et al., 2004 Xing, 2004 Xing, 2004 Muthard & Wickens, 2005 Morberly & Langham, 2002 Beijer et al., 2004 Tullis, 1997 Rosenholtz et al., 2005 Also collected subjective comments.
Hypotheses • H1 - Expected higher ratings of perceived clutter for images with more active features (or visual density). • H2 - Expected certain descriptors of clutter to have greater relevance than others for HUD configurations. (e.g., Brightness of EVS imagery causes PFD symbology to be obscured - pilot might rate “indiscernible/discernible” as high.) • H3 - Finite set of display qualities may drive clutter. (Pilots will use limited set of terms from literature to describe HUD clutter.)
Data Analyses • ANOVA on overall clutter ratings with HUD features as predictors. • Correlation analysis on number of active display features and ratings of clutter (to assess H1). • Regression analysis of utility of display descriptors for predicting likelihood of overall clutter ratings - for each HUD configuration in each scenario (to assess H2). (Used to describe pilot psychophysical function - How does presence of specific HUD features relate to likelihood of perceived clutter rating and pilot use of specific descriptor terms?) • Factor analysis to identify latent display qualities (principal components (PC)) driving variance in clutter rating (to assess H3). Addressing Objective #1 Addressing Objective #2 Addressing Objective #3
ANOVA Results All HUD features were significant (p<0.05) predictors of perceived clutter (independently). All two-way interactions including SVS, EVS or TCAS were significant. When PRIMARY mode was active, no effect of SVS, EVS and TUNNEL on perceived clutter. (Focus on symbology vs. non-iconic visuals, compared to IMC mode.)
Simple Regression Model and Correlation Analysis • Reduced model of overall clutter with only significant terms fit to response: • As number of active display features increased so did pilot ratings of clutter (H1). • Possible visual density of displays (iconic and non-iconic images) was key predictor of clutter ratings. p < 0.0001 R2 = 0.69 r = 0.42; p < 0.0001
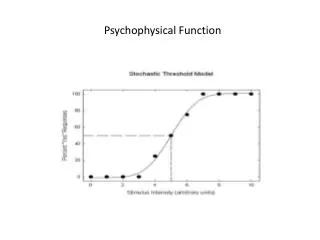
Psychophysical Transfer Function Probability model of clutter • Significant parameters in regression models of likelihood of perceived clutter (representing descriptor terms) were identified for each pilot and trial. Model described by linear combination How do you generate clutter rating based on display content? Compared observed CDF with parametric models Gamma model of log-likelihood of perceived clutter based on display characteristics
Selection of Clutter Descriptors • Mean regression model parameter coefficients were used to identify pairs of terms with greatest strength for describing clutter. • Top-5 pairs from transfer function analysis: • “redundant/orthogonal” • “monochromatic/colorful” • “not salient/salient” • “unsafe/safe” • “sparse/dense” • Pairs represent perceptual qualities of HUDs pilots consider relevant for describing clutter. • Certain pairs of terms are considered more/less relevant for characterizing display clutter (H2).
Factor Analysis • Conducted FA to assess relationships among pairs of terms in explaining clutter ratings. • Used principal components analysis (PCA) with orthogonal varimax rotation. • Four PCs were sufficient to explain majority of variance (~78%) in overall clutter ratings (H3). (Ratings of utility of terms for describing clutter revealed clear loading pattern on abstract display qualities.) • “Global Display Density” (30%) • “Similarity of Features” (21%) • “Clarity of Features” (16%) • “Dynamic Nature of Displays” (12%) Use to develop subjective rating scales
Conducted additional factor analysis using only two PCs. (Identify HUDs considered similar in terms of underlying dimensions of clutter.) • Generated biplot of HUDs with PCs as axes. MDPREF • Displays integrating EVS and TUNNEL were considered more easily described in terms of clutter. • “Fully-loaded” displays (SVS, EVS, TUNNEL, TCAS and PRIMARY symbology) considered to be most characteristic of “cluttered” displays. X-axis Y-axis
Inferences • Pilot perceptions of clutter may be less affected by presentation of SVS, EVS and TUNNEL under PRIMARY mode due to focus on added symbology compared to IMC mode. • Latent variables from FA corresponded with select pairs of terms for describing HUD clutter, based on psychophysical function analysis. • Pilot understanding of underlying factors in clutter may have changed throughout study: • Initial rankings of pairs of clutter descriptor terms were significantly correlated with post-experiment rankings, but not perfectly. • Supports context and display dependence of clutter. • Exposure to advanced HUDs may allow pilots to refine internal concepts of visual and information density. • May lead to changes in perception of factors in clutter (over time). r = 0.69; p < 0.0001
Conclusions • Experiment achieved goals… • Modeled perceptions of advanced HUD clutter based on information features. • Identified features combinations driving perceived clutter. • Determined how expert pilots characterize HUD clutter. • Identified underlying display qualities in perceived clutter. • Caveats: • Small sample size - lower accuracy in estimation of mean and variance in ratings; limited sensitivity of regression analysis; and limits generalizability of results to larger pilot population. • Only used static HUD images to assess perceived clutter. (Display dynamics also considered as potential underlying factor in perceived clutter. Will be studied in second year.)
Future Research Investigate HUD clutter ratings in high-fidelity simulator (IFD). (Use rating scales based on latent variables from FA.) Develop model of pilot control behavior, based on HUD content. Assess impact of low-level display property manipulations on pilot translation of display input to control output. Develop model of perceived clutter in basic display properties (found to be significant in mediating control behavior). Correlation analysis on perceived clutter and performance. Model pilot performance in terms of basic display properties and clutter ratings (What does unit change in clutter mean?) Result - Model allowing researchers/designers to quantitatively define level of clutter for given interface. Expected to have applicability for NextGen display concepts, beyond E/SVS HUDs.