Download
1 / 10
100 likes | 230 Views
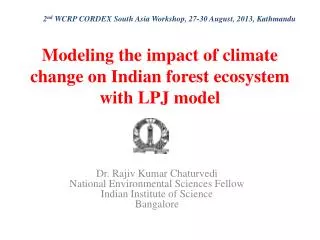
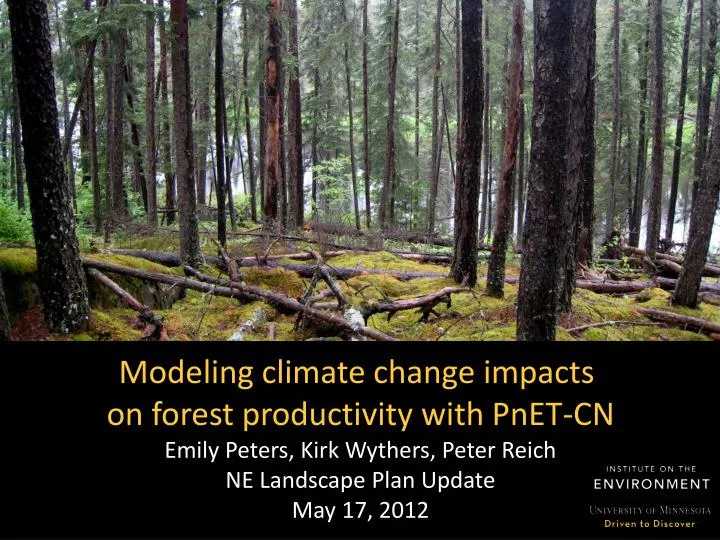
Modeling climate change impacts on forest productivity with PnET-CN Emily Peters, Kirk Wythers, Peter Reich NE Landscape Plan Update May 17, 2012. PnET-CN Model Overview. - Simulates carbon, water, and nitrogen cycling in forests. “Big-leaf” model. Stand/ ecosystem scale.

E N D
Modeling climate change impacts on forest productivity with PnET-CN Emily Peters, Kirk Wythers, Peter Reich NE Landscape Plan Update May 17, 2012
PnET-CN Model Overview - Simulates carbon, water, and nitrogen cycling in forests • “Big-leaf” model • Stand/ ecosystem scale • Represents forest types - Monthly time step Aber et al. 1997 Ecological Modelling
Model Inputs • Climate variables • - air temperature • - precipitation • solar radiation • CO2 concentration • N deposition rates • O3 concentration (D40) • Site parameters • soil water holding capacity • land use history Vegetation parameters (n=46) - canopy traits (leaf lifespan, thickness) - photosynthesis & respiration - water balance - carbon allocation - biomass turnover - N concentration
Model Outputs • C cycling • - Net primary production (wood, leaves, roots) • - Net ecosystem production • C storage (wood, leaves, roots) • N cycling • Net N mineralization • Net nitrification • Foliar N concentration • H2O cycling • Evapotranspiration Ex: hardwood forest in West Virginia Davis et al. 2009 For. Eco. & Mgmt
Climate Change Application Ex: hardwood forest in New Hampshire Ollinger et al. 2009 Mit. Ad. Strat. Glob. Chg.
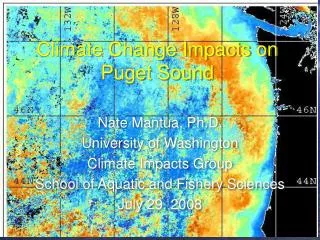
Regional Application Pan et al. 2009 For. Eco. Mgmt
MN Climate Change Response Framework source: USFS 2007 • Model simulations from 1960 to 2100 • 2 climate scenarios: high & low emissions • 1 km resolution
Expected Analyses 1. Maps of NPP and change in NPP for 2040, 2070, and 2100 2. Compare relative influence of different global change factors on NPP (e.g. CO2, temperature, O3, N deposition) Pan et al. 2009 For. Eco. Mgmt
Expected Analyses 3. What forest types do better/worse over time? NPP 4. And where? Time (years) + 0 NPP change (%) - Water holding capacity
Contact Information Emily Peters Ecologist, Postdoc ebpeters@umn.edu 612-626-2120 Kirk Wythers kwythers@umn.edu 612-625-2261 Peter Reich Lead P.I.