Download
1 / 23
230 likes | 303 Views
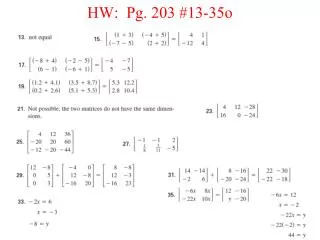
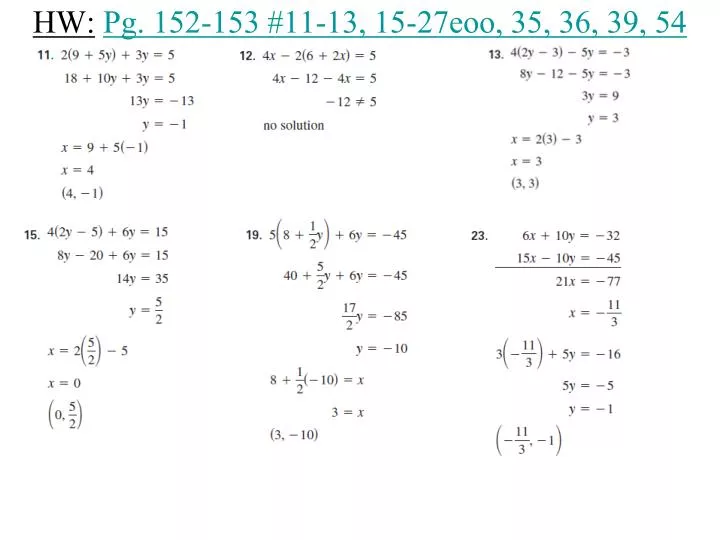
HW: Pg. 152-153 #11-13, 15-27eoo, 35, 36, 39, 54. HW: Pg. 155 #2-18 eoe. Animated Activity Online. Systems of Linear Inequalities: http://www.classzone.com/cz/books/algebra_2_2007_na/resources/applications/animations/explore_learning/chapter_3/dswmedia/7_6_LinearInequal.html.

E N D
Animated Activity Online Systems of Linear Inequalities: http://www.classzone.com/cz/books/algebra_2_2007_na/resources/applications/animations/explore_learning/chapter_3/dswmedia/7_6_LinearInequal.html
3.3 Graphing and Solving Systems of Linear Inequalities EXAMPLE 1 Graph the system of inequalities. Inequality 1 y > –2x – 5 y <x + 3 Inequality 2
STEP 1 Graph each inequality in the system. Use red for y > –2x – 5and bluefory≤ x + 3. STEP 2 Identify the region that is common to both graphs. It is the region that is shaded purple. 3.3 Graphing and Solving Systems of Linear Inequalities EXAMPLE 1 SOLUTION Graph a system of two inequalities
3.3 Graphing and Solving Systems of Linear Inequalities EXAMPLE 2 Graph the system of inequalities. 2x + 3y < 6 Inequality 1 Inequality 2
STEP 1 Graph each inequality in the system. Use red for2x + 3y <6 and bluefor STEP 2 Identify the region that is common to both graphs. There is no region shaded both red and blue. So, the system has no solution. 3.3 Graphing and Solving Systems of Linear Inequalities EXAMPLE 2 SOLUTION Graph a system with no solution
3.3 Graphing and Solving Systems of Linear Inequalities EXAMPLE 3 Graph a system with an absolute value inequality Graph the system of inequalities. Inequality 1 y < 3 Inequality 2
STEP 1 Graph each inequality in the system. Use red for y ≤3 and bluefor STEP 2 Identify the region that is common to both graphs. It is the region that is shaded purple. 3.3 Graphing and Solving Systems of Linear Inequalities EXAMPLE 3 SOLUTION Graph a system with an absolute value inequality
Graph the system of inequalities. 2. 1. y < 3x – 2 4x – y < 5 y > – x + 4 for Examples 1, 2 and 3 GUIDED PRACTICE
3. x + y > – 3 –6x + y < 1 for Examples 1, 2 and 3 GUIDED PRACTICE 4. y < 4
3.3 Graphing and Solving Systems of Linear Inequalities EXAMPLE 4 SHOPPING Solve a multi-step problem A discount shoe store is having a sale, as described in the advertisement shown below. • Use the information in the ad to write a system of inequalities for the regular footwear prices and possible sale prices. • Graph the system of inequalities. • Use the graph to estimate the range of possible sale prices for footwear that is regularly priced at $70.
STEP 1 Write a system of inequalities. Let xbe the regular footwear price and let ybe the sale price. From the information in the ad, you can write the following four inequalities. Solve a multi-step problem EXAMPLE 4 SOLUTION x ≥ 20 Regular price must be at least $20. x ≤ 80 Regular price can be at most $80. y ≥ 0.4x Sale price is at least (100 – 60)% = 40% of regular price. y ≤ 0.9x Sale price is at most (100 – 10)% = 90% of regular price.
ANSWER STEP 2 Graph each inequality in the system. Then identify the region that is common to all the graphs. It is the region that is shaded. Therefore, footwear regularly priced at $70 sells for between $28 and $63, inclusive, during the sale. Identify the range of possible sale prices for $70 footwear. From the graph you can see that when x = 70, the value of yis between these values: STEP 3 EXAMPLE 4 Solve a multi-step problem 0.4(70) = 28 and 0.9(70) = 63 So, the value ofysatisfies28 ≤ y ≤ 63.
5. In Example 4, suppose the advertisement showed a range of discounts of 20% – 50% and a range of regular prices of $40 – $100. b. Use the graph to estimate the range of possible sale prices for footwear that is regularly priced at $60. for Examples 4 GUIDED PRACTICE a. Write and graph a system of inequalities for the regular footwear prices and possible sale prices. x ≥ 40 Regular price must be at least $40. x ≤ 100 Regular price can be at most $100. y ≥ 0.5x Sale price is at least (100 – 50)% = 50% of regular price. y ≤ 0.8x Sale price is at most (100 – 20)% = 80% of regular price. ANSWER 30≤y≤ 48
Homework: Pg. 160-161 #33-49o, 51