Download
1 / 57
570 likes | 691 Views
Deriving Performance Models from UML Specifications by Graph Transformations. Dr. Dorina Petriu Carleton University Department of Systems and Computer Engineering Ottawa, Canada, K1S 5B6 http://www.sce.carleton.ca/faculty/petriu.html. Outline. Motivation Background

E N D
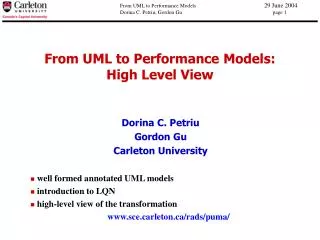
Deriving Performance Models from UML Specifications by Graph Transformations Dr. Dorina Petriu Carleton University Department of Systems and Computer Engineering Ottawa, Canada, K1S 5B6 http://www.sce.carleton.ca/faculty/petriu.html IEEE Ottawa Computer Chapter talk
Outline • Motivation • Background • Layered Queueing Network (LQN) performance models • OMG Performance Profile • Methodology for performance model derivation • Generation of LQN performance models by graph transformations based on the graph-grammar formalism • 2-phase transformation • Example: analysis of a telecommunication system • from UML to LQN • performance analysis • Conclusions Dorina C. Petriu
Motivation • Software Performance Engineering (SPE) [Smith90]: • integrate performance evaluation into the software development process from the early stages throughout the whole life-cycle • requires the construction and analysis of performance models • Why SPE is not frequently applied in practice: • cognitive gap between the software development domain and the performance analysis domain • pressure for “shorter time to market” leaves no time for SPE • Importance of SPE recognized by OMG: definition of a performance profile • Present research: automate the derivation of LQN performance models from UML design models: • LQN model structure generated from high-level software architecture • LQN model parameters from software execution model (activity diagrams). Dorina C. Petriu
Layered Queueing Network (LQN) • LQN is an extended Queueing Network model: • both software tasks and hardware devices are represented (drawn as parallelograms and circles) • nested services are allowed (a server is also a client to other servers) • software components have entries corresponding to different services • arcs represent service requests • synchronousand asynchronous requests • multi-servers used to model components with internal concurrency • Typical LQN results: throughputs, response times, utilization. • LQN use: • for identigying and eliminating bottlenecks which limit the system performance • for capacity planning and scalability analysis. Client_1 Client_2 Proc 2 Proc 1 Application Database Proc 3 Disk 1 Disk 2 Example: LQN model of a three-tiered client-server system Dorina C. Petriu
Types of LQN messages and phases Client Client synchronous message phase1 (service) reply Server Server busy idle phase2 phase3 (autonomous phases) included services a) LQN synchronous message Client Client asynchronous message phase1 Server Server busy idle phase2 phase3 included services b) LQN asynchronous message Client Client synchronous message Server1 Server1 busy phase1 phase2 idle reply to original client forwarding Server2 Server2 busy idle phase1 phase2 idle c) LQN forwarding message Dorina C. Petriu
T1 P1 a2 a4 + + + + a9 & a6 a3[e1] Sleep_T Sleep_P LQN extensions: activities, fork/join in an entry a1 & 0.5 0.5 0.5 0.5 a5 a7 a8 a10 P2 T2 T6 T4 T5 T3 P6 P3 P4 P5 Dorina C. Petriu
Approach to converting UML to LQN models UML Model LQN Model Graph Transformations Performance Annotations Dorina C. Petriu
OMG’s Performance Profile • OMG is in the process of defining a performance profile intended to enable quantitative performance analysis of UML models. • The profile extends the UML metamodel for attaching performance information to a UML model with • stereotypes • tagged values • constraints • In order to conduct quantitative performance analysis of a UML model: • one must first translate the UML model into a performance model • use an existing performance analysis tool • import back in the UML model the analysis results Dorina C. Petriu
PerformanceContext 1 0..n 1 1..n 1..n 1..n Presource utilization schedulingPolicy throughput 1..n 1 0..n 0..n PScenario hostExecDemand responseTime Workload responseTime priority 0..n 1 {ordered} +root 1 1..n PStep probability repetition delay operations interval executionTime ClosedWorkload population externalDelay OpenWorkload occurencePattern +successor +predecessor +host 0..1 PPassiveResource waitingTime responseTime capacity accessTime PProcessingResource processingRate contextSwitchTime priorityRange isPreeemptible Performance Profile: the domain model Dorina C. Petriu
Deployment Diagram Architectural Information Activity Diagram Sequence Diagrams Performance Annotations Collaboration Diagram Performance Annotations Implementation: 2-phase transformation LQN Models Dorina C. Petriu
reqType := checkRequest() Customer Registration Add/drop product Checkout Top level sequence diagram for e-commerce application s:serverSocket m:mainServerThread :client listen() connectionRequest() iteration box callback() accept() new w:workerThread * [forever] write(menu) iteration expression get(serviceRequest) iteration box [reqType = registration] composite subdiagram [reqType = browse] Browse [reqType = add | reqType = drop ] [reqType = buy] * [reqType != done] [reqType= done] reply(endMsg) iteration expression Dorina C. Petriu
server client connect request s.listen() m.callback s.accept new(w) w.write(menu) menu wait for request unspecified service request w. get(serviceRequest) w.reqType:=checkRequest() [reqType = done] composite activity [reqType=add | reqType=drop ] [reqType =registration] [reqType= browse] [reqType = buy] reply(endMsg) Customer registration Browse Add/drop Product Checkout endMsg unspecified w.terminate Activity diagram corresponding to the previous SD Dorina C. Petriu
client workerthread database register Reply with registration form form [to fill] unspecified form [filled] Create account and add to database account addAccount reply Display account created account More detailed SD and corresponding AD Corresponding activity diagram SD for the iteration box from the top-level diagram specialized for “registration” w:workerThread database :client get(serviceRequest) reqType :=checkRequest() [reqType = registration] reply (registrationForm) send(form) new :customerAcct fillIn() addAccountt() reply(account) * [reqType != done] iteration box composite subdiagram iteration expression Dorina C. Petriu
<<Modem>> m1 bits/s <<Modem>> m2 bits/s 1. Connect 2. Registration 3. Browse 4. Add/Drop 5. Checkout 6. Disconnect Server Database ProcS ProcDB Modem ProcC From architectural patterns and deployment info to LQN Client Client Client Internet <<Internet>> <<LAN>> r bit/sec 1 2 3 4 5 6 Server <<LAN>> r bit/sec Database disk <<disk>> Dorina C. Petriu
endMsg Determine server entries and phases from AD server client connect request s.listen() The resource demands are aggregated separately for each area m.callback s.accept new(w) w.write(menu) entry1, phase 1 menu wait for request unspecified service request w. get(serviceRequest) w.reqType:=checkRequest() entry 2 - 5, phase 1 [reqType = done] entry6, phase 1 [reqType=add | reqType=drop ] [reqType =registration] [reqType= browse] [reqType = buy] reply(endMsg) Customer registration Browse Add/drop Product Checkout unspecified w.terminate entry6, phase 2 Dorina C. Petriu
Architectural Information Input Graph Sequence Diagrams Represented by Performance Annotations Output Graph Activity Diagram Representing Producing Activity Diagram (Phase1 transformation) Transformation Rules Objective: Identifying flows of control Dorina C. Petriu
SD to AD transformation principles for a single execution thread r m n a) Sequential execution a() m.a n.b b() m.a n.b r m n a() [c=c1] [c=c2] c:= b() b) Branch and merge [c=c1] d() n.d n.f [c=c2] f() g() n.g r m n a() m.a c) Iteration (looping) b() *[loop condition] c() n.b n.c *[loop condition] Dorina C. Petriu
SD to AD transformation principles for multiple execution threads r m n a a a) Synchronous message send and reply reply m.action(a) b() reply n.b s r b) Asynchronous creation of an active object s.a new(m) a() new m n c() b() s.c n.b s r m n s.a n.b a() b() c) Asynchronous message c c d() f() n.d r.action(c) s.f Dorina C. Petriu
Graph Transformations and PROGRES • We are using a known graph rewriting tool named PROGRES (PROgramming with Graph Rewriting Systems) [Schürr90, Schürr94, Schürr97] • The essential idea of all implemented graph grammars or graph rewriting systems is that they are generalization of string grammars (used in compilers) or term rewriting systems. • The terms “graph grammars” and “graph rewriting systems” are often considered synonymous, however: • a graph grammar is a set of production rules that generates a language of terminal graphs and produces nonterminal graphs as intermediate results. • a graph rewriting system is a set of rules that transforms one instance of a given class of graphs into another instance of the same class of graphs without distinguishing terminal and nonterminal results. Dorina C. Petriu
PROGRES Schema • PROGRES transforms an attributed input graph into an attributed output graph. • The graph schemashows the types of nodes and edges composing a valid graph • we have built it to resemble closely the UML metamodel • A set of production rules are applied in a controlled way in order to performs the graph transformations. • a production rule has a left-hand side defining a graph pattern that will be matched in the overall graph then replaced by the right-hand side • nodes and edges can be deleted, added or modified • a rule also shows how to compute the attributes of the new nodes from the attributes of the nodes that were replaced Dorina C. Petriu
Schema notation • PROGRES uses inheritance (possible multiple) to define hierarchies of node classes • Square boxes represent node classes(can haveattributes) • inheritance relationships are represented with dotted edges • node classes correspond to abstract classes in UML • Rounded-corner boxes represent node types • connected with their uniquely defined classes by the means of dashed edges. • node types are leaves of the node class hierarchy, and are used to create node instances in a PROGRES graph. • a node type specializes only one class • Solid edgesbetween edge classes represent edge types, which define the relationships between node instances. • Node attributesare shown as small circles attached to the class or type boxes. Dorina C. Petriu
PROGRES Schema for SD to AD transformation Call Action Sequence Diagram Synch Asynch Reply Call Send Signal SIGNAL Active Passive real real Local Operation RcvTime seq SendTime integer arg dispatch sender Sequence Diagram Size Create Action INSTANCE MESSAGE ACTION receiver effect perform ll_next owns Destroy Action contains guarded Component Terminate Action maps_to Guard Condition MODEL ELEMENT DIAGRAM Name Return Action string maps_to has cross_ref Init Action flow owns contains Activity Diagram c_flow_in Conditional Arc STATE Partition SIMPLE STATE CTRL BLOCK COMPOSITE STATE d_in Activity Diagram c_flow d_out SubActivity state Initial state Final state Activity state ObjFlow state ALTERNATIVE PARALLEL Join Merge Branch Fork Dorina C. Petriu
undefined waiting Corresponding activity diagram with swimlanes and object flow Example of a sequence diagram with concurrency x y z x.send(a) receive synch msg a x y u fork new thread y.receive(a) u.b() new(z) a object flow b() z new z.init() new(v) new v d() [c = c1] [c = c2] [c = c1] g() v.h() v.g() [c = c2] h() u.d() send asynch msg delete(v) z.delete(v) z.send(f) f h() receive asynch msg r f send reply y.receive(f) u.h() y.send(r) z.terminate() 2nd component 1st component 3rd component r x.receive(r) Dorina C. Petriu
Not all edges sender, receiver and perform are shown. Example of PROGRES input graph SD comp1 comp2 comp3 y x u a x y u 1 :Receive a b b() :Send z 2 :Call :Local z new new v :Init new :Create 3 v new :Local d() d :Create 4 [c = c1] g() 5 :Call :Local Guard :Local g [c = c2] h() :Call 6 delete(v) Guard f :Local h h() :Call 6 r :Local delete 7 :Destroy f :Receive 2nd thread comp2 1st thread comp1 3nd thread comp3 :Send 8 h 9 :Call :Local :Terminate :Receive r :Send 10 Dorina C. Petriu
Not all edges sender, receiver and perform are shown. Detailed mapping from SD to PROGRES graph SD comp1 comp2 comp3 y x u receiver sender perform perform x y u 1 :Receive a disp effect b a b() seq z :Send 2 :Call :Local new z new v :Init ll_next new :Create 3 v new :Local d() d :Create 4 [c = c1] g() 5 :Call :Local Guard :Local g [c = c2] h() :Call 6 delete(v) Guard f :Local h h() :Call 6 r :Local delete 7 :Destroy f :Receive 2nd thread comp2 1st thread comp1 3nd thread comp3 :Send 8 h 9 :Call :Local :Terminate :Receive r :Send 10 Dorina C. Petriu
waiting y.receive(a) Generating an AD: apply “top” rule (1) SD contains contains comp2 comp1 comp3 comp1 comp2 comp3 owns owns owns x y u y x u a a b() :Send 1 maps-to maps-to maps-to z maps-to new :Receive b z 2 :Call :Local new :Create :Init 3 AD x.send(a) partition1 partition2 partition3 owns owns a waiting: ActivityState x:InitialSt u.b() new(z) z.init() Dorina C. Petriu
waiting Generating an AD: apply “synchr. message” rule (2) SD comp2 comp1 comp3 comp1 comp2 comp3 x y u y x u receiver sender a perform a perform b() :Send 1 z effect new dispatch :Receive b z 2 :Call :Local new :Create :Init 3 AD x.send(a) partition1 partition2 partition3 owns owns a waiting x:InitialSt flow flow d_in y.receive(a) d_out :Join x:send a:ObjFlow flow u.b() y.receive(a) new(z) z.init() Dorina C. Petriu
waiting Generating an AD: apply “operation call” rule (3) SD comp2 comp1 comp3 comp1 comp2 comp3 x y u y x u a a b() receiver perform :Send 1 sender new z :Receive seq b z 2 :Call :Local effect dispatch new :Create :Init 3 AD x.send(a) partition1 partition2 partition3 owns owns a waiting x:InitialSt flow flow d_in y.receive(a) d_out :Join x:send a:ObjFlow flow u.b() y.receive(a) flow u.b() new(z) z.init() Dorina C. Petriu
waiting Generating an AD: apply “create thread” rule (4) SD comp2 comp1 comp3 comp1 comp2 comp3 x y u y x u a owns a b() sender :Send 1 z new :Receive b :Local z 2 :Call receiver perform new :Create :Init 3 dispatch effect AD x.send(a) partition1 partition2 partition3 owns owns a waiting x:InitialSt flow flow d_in y.receive(a) d_out :Join x:send a:ObjFlow flow owns u.b() y.receive(a) flow new(z) u.b() flow new(z) flow z.init() flow :Fork Dorina C. Petriu
Deployment Diagram Input Graph Activity Diagram Represented by Collaboration Diagram Performance Annotations Output Graph LQN Models Representing Building LQN Models (Phase2) Transformation Rules Dorina C. Petriu
Architectural patterns • The literature identifies a relatively small number of architectural patterns which describe the collaboration between high-level components (mostly concurrent): • pipe and filters • client server • broker • layers • critical section • master-slave • The high-level architecture of a software system as described by architectural patterns will determine the structure of the LQN performance model. • LQN nodes represent concurrent components or high-level objects and hardware devices. Dorina C. Petriu
UML diagrams for generating the LQN structure • Collaboration • an abstraction mechanism used to represent architectural patterns • represents “a society of classes, interfaces, and other elements that work together to provide some cooperative behaviour that is bigger than the sum of all of its parts” • a collaboration has two aspects: structural and behavioural (only the structure is directly used to generate the LQN nodes) • Deployment diagram with component instances • identifies runtime component instances • shows their allocation to physical devices • What do LQN tasks represent • software component instances (according to the architectural patterns in which they are involved) • hardware devices Dorina C. Petriu
filter2 filter1 filter1 filter2 Transformation of Pipeline and Filters pattern to LQN UpStreamFilter DownStreamFilte PIPELINE WITH MESSAGE filter1 filter2 UpStreamFilt DownStreamFilter <<process>> filter1 <<process>> filter2 All filters running on the same processor node UpStreamFilter DownStreamFilter Buffer semaphore write read PIPELINE WITH BUFFER and buffer proc UpStreamFilter DownStreamFilter Buffer 1..n 1..n buffer Filters running on different processor nodes <<process>> filter1 <<process>> filter2 write() {sequential} read() {sequential} read() write() Note 1: only the structural view is used to transform a UML collaboration to LQN. semaphore Note 2: a pattern may produce different LQN models depending on factors such as processor allocation. (obtained from the deployment diagram) proc1 write read proc2 Dorina C. Petriu
Transformation of the basic Client-Server pattern to LQN Client Server CLIENT SERVER Client Client client1 client2 1..n 1..n <<process>> client2 <<process>> client1 service2 () service1 service2 Server service1() service2 () server server service1() service2() • Each software process (client or server) is modelled as an LQN task • Each server operation is modelled as an entry • A client may request more than one server operation; each request is modelled as an LQN synchronous message arc. • Auxiliary performance information: average execution time for each client and server entry; average number of requests associated with each LQN message arc. Dorina C. Petriu
Transformation of the Critical Section collaboration Users on the same processor node . . . user1 userN Accessor Shared semaphore and critical sections f1 f2 . . .fN CRITICAL SECTION Accessor Accessor proc <<process>> user1 <<process>> userN . . . Users on different processor nodes f1 () Shared fN () . . . user1 userN shared f1 () {sequential} f2 () {sequential} . . . fN () {sequential} semaphore 1 2 ... N . . . procN proc1 f1 fN Dorina C. Petriu
How to identify architectural patterns • Recognize the pattern of interaction between participants from the detailed behaviour described in the activity diagrams • For example, client-server interactions are easy to recognize when the client sends a synchronous message to the server and waits for the reply • Client-server interactions can also be realized through asynchronous messages - a little more difficult to identify. • Some interaction patterns are more difficult to recognize, as for example pipeline with buffer, critical section, etc. • The designer of the UML model indicates explicitly the architectural patterns used. • Check if the detailed behaviour conforms to the pattern indicated by the designer. Dorina C. Petriu
Example: telecom system deployment diagram requests <<LAN>> r bit/sec <<multiprocessor>> <<LAN>> Service Provider Database s bit/sec ServiceProvider component instance contains several concurrent high-level object Dorina C. Petriu
COALLOCATION COALLOCATION UpStrmFilter DownStrmFilter Buffer Container Contained Container Contained UpStrmFilter DownStrmFilter PIPELINE WITH MESSAGE PIPELINE WITH BUFFER <<process>> Stack StackIn StackOut <<process>> IO IOin IOout doubleBuffer inBuffer outBuffer 1..n <<process>> RequestHandler UpStrmFilter DownStrmFilter Buffer UpStrmFilter DownStrmFilter Client Server PIPELINE WITH MESSAGE PIPELINE WITH BUFFER CLIENT SERVER ShMem2 ShMem1 <<process>> DataBase alloc() {sequential} free() {sequential} update() {sequential} Accessor Shared Accessor Shared CRITICAL SECTION CRITICAL SECTION Example: telecommunication system architecture ServiceProvider component Database component Dorina C. Petriu
ShMem2 DataBase ShMem1 ReqHandler alloc () get (script) interpret (script) update () free () Main scenario represented as sequence diagrams StackIn IOin inBuffer ReqHandler outBuffer IOout StackOut :client input (req) enqueue (req) reserve() write (req) signal (awake) read (req) process (req) write (result) signal (awake) read (result) pass (result) sendBack (result) Details of process (req) Dorina C. Petriu
ShMem2 DataBase ShMem1 <<PAstep>> {Pademand = (‘meas’, ‘mean’, 0.120, ‘ms’)} <<PAstep>> {Pademand = (‘meas’, ‘mean’, 0.4028, ‘ms’)} <<PAstep>> {Pademand = (‘meas’, ‘mean’, 0.6749, ‘ms’)} <<PAstep>> {Pademand = (‘meas’, ‘mean’, 0.1328, ‘ms’)} <<PAstep>> {Pademand = (‘meas’, ‘mean’, 0.120, ‘ms’)} <<PAclosedLoad>> {PAPopulation = $Nusers, PAextDelay = (‘mean’, asgn’, 20, ‘ms’)} <<PAstep>> {Pademand = (‘meas’, ‘mean’, 0.120, ‘ms’)} <<PAstep>> {Pademand = (‘meas’, ‘mean’, 0.4028, ‘ms’)} <<PAstep>> {Pademand = (‘meas’, ‘mean’, 1.998, ‘ms’)} <<PAstep>> {Pademand = (‘meas’, ‘mean’, 0.105, ‘ms’)} <<PAstep>> {Pademand = (‘meas’, ‘mean’, 0.1576, ‘ms’)} <<PAstep>> {Pademand = (‘meas’, ‘mean’, 0.105, ‘ms’)} ReqHandler alloc () get (script) interpret (script) update () free () Main scenario represented as sequence diagrams StackIn IOin inBuffer ReqHandler outBuffer IOout StackOut :client input (req) enqueue (req) reserve() write (req) signal (awake) read (req) process (req) write (result) signal (awake) read (result) pass (result) sendBack (result) Details of process (req) Dorina C. Petriu
write(result) pass(result read (result) read (req) write (req) wait wait wait wait reserve send(result input (req) wait req awake Main scenario represented as activity diagram StackIn IOin inBuffer ReqHandler outBuffer IOout StackOut enqueue (req) process (req) awake result Dorina C. Petriu
DataBase ProcDB LQN model for the telecom system l StackIn IOin Request Handler Dummy Proc StackOut IOout IOexec StackExec update ShMem2 pull push alloc free Buffer ShMem1 Proc • Obtained by graph transformation from the following UML diagrams • high-level system architecture (described by UML collaborations) • deployment diagram showing the allocation of software components to physical devices. Dorina C. Petriu
Average execution times per request Dorina C. Petriu
Max throughput for 1, 4 and 6-processor configurations Dorina C. Petriu
Base Case, 1-processor: hardware bottleneck Dorina C. Petriu
Base Case, 4-proc: software bottleneck Dorina C. Petriu
Base Case, 6-proc: stronger software bottleneck Dorina C. Petriu
waiting waiting What is the bottleneck task IOout doing ? IOout is doing only 0.12 ms of useful work on behalf of a system request. Nonetheless, it is the system bottleneck. useful work RequestHandler is doing 2.75 ms of useful work on behalf of a system request. However, it is not the system bottleneck. waiting waiting useful work Dorina C. Petriu
l StackIn IOin Request Handler StackOut IOout alloc free read write write read update DataBase ShMem2 BufferOut BufferIn ShMem1 Proc LQN model of the modified system • The original software architecture suffers from serializations constraints at the level of IO process, Stack process and doubleBuffer • Eliminate the serialization constraints in two steps: • Each pipeline filter will run on its own process (thread of control) • Split the pipeline buffer into two separate buffers, each controlled by its own semaphore. Dorina C. Petriu
Modified system 4-proc configuration: software bottleneck eliminated Dorina C. Petriu