Download
1 / 51
510 likes | 663 Views
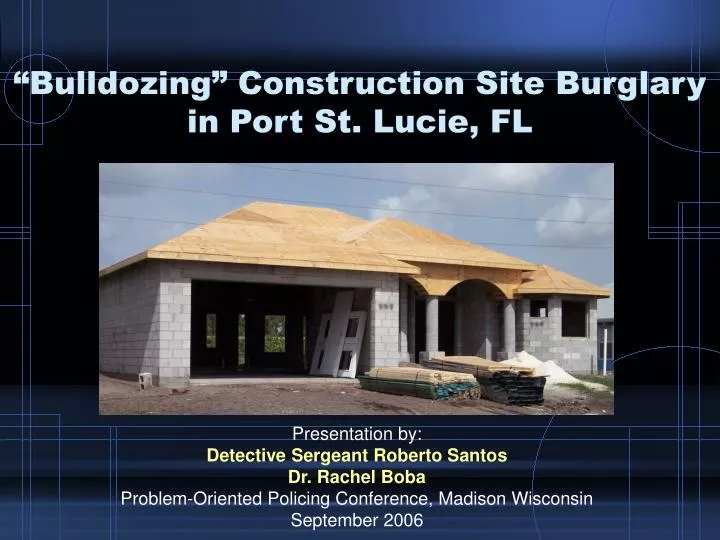
“Bulldozing” Construction Site Burglary in Port St. Lucie, FL. Presentation by: Detective Sergeant Roberto Santos Dr. Rachel Boba Problem-Oriented Policing Conference, Madison Wisconsin September 2006. Port St. Lucie, FL Hurricane Frances, 2004. Port St. Lucie, FL Hurricane Jeanne, 2004.

E N D
“Bulldozing” Construction Site Burglary in Port St. Lucie, FL Presentation by: Detective Sergeant Roberto Santos Dr. Rachel Boba Problem-Oriented Policing Conference, Madison Wisconsin September 2006
Port St. Lucie, FL • 151,000 population • One of the fastest growing in the US • 115 square miles • 255 authorized sworn • Implementing Integrated Model of Problem Solving, Analysis, and Accountability
Scanning • Growth is a key issue for both city and PD • Population to increase to 214,997 by 2016 • 450 to 600 new building permits per month • 6,000 homes under construction any given day • Department recognized as a problem
Analysis Process • Previous responses • Department-wide committee • Define the problem • Develop hypotheses • Data collection • Analysis results • Response recommendations
Definition of the Problem • Single family homes • Burglary: from within the buildings • Theft: from the construction sites • No vandalism • City-wide focus
Hypotheses • Trollers • Individuals drive around neighborhoods looking for the opportunity to take property from construction sites for resale or personal use • Insiders • Builders and subcontractors steal from one another to use the stolen property in ongoing work and to sell • Professionals • Individuals who make a living at burglary and selling stolen goods
Data Collection:Police Reports • Data from 2004 • Report narratives • Reviewed to determine inclusion in study • MO characteristics • Level of difficulty • Aggregate data analyzed • Date, time, location • Property taken • Builder (victim) information
Data Collection:CSBT Check Sheet • New information collected by at the scene • Additional check sheet to accompany report • Information collected: • Builder information • Subcontractor information • Property delivered by • Insurance information • Stage of building • Tools needed
Data Collection: Builders and Building Department • Presented some information but keyed on obtaining information • Builder’s practices • Subcontractor characteristics • Crime problems • Crime prevention
Spatial Analysis Geographically focused: Most crime in the southwest No repeat victimization of sites: Only 12 of 254 addresses victimized twice
Clearances • 1.9% (5 of 266 cases) were cleared by arrest of either an adult or a juvenile • 2.6% (7 cases) were exceptionally cleared (adult)
Property Taken • The top six types of property constitutes 70.5% of all property taken.
Difficulty Characteristics • Each narrative was coded using the values below • Actual offender behavior not known, so skill and transport were estimated based on MO and property type
Difficulty Characteristics • Each narrative was coded using the values below • Actual offender behavior not known, so skill and transport were estimated based on MO and property type
Difficulty Characteristics • Each narrative was coded using the values below • Actual offender behavior not known, so skill and transport were estimated based on MO and property type
Difficulty Characteristics • Each narrative was coded using the values below • Actual offender behavior not known, so skill and transport were estimated based on MO and property type
Difficulty: Skill • 90% of crimes required some sort of skill
Difficulty: Transport • 88% of property needed at least a small car/truck for transport
Difficulty: Access • 75% of property was more difficult to access
Stage of Building • Builders and officers’ experience also support these conclusions.
Focus Groups Builders • Subcontractors often provide their own materials • Crime less than $300 not typically reported • Tension between the builders and the building department • Builders believe that the homes are most vulnerable in the final stages of building Building Department • Appliance installation not required before closing • On average, it takes about 10.5 months to build a house • Electricity meter inspections occurs when the house is securable and safe • Change in building culture in recent years
Analysis Findings • Targets: 6,000 homes under construction per day • Geographically focused: southwest • Repeat victimization of builders, not addresses • Low arrest rate • Construction supplies/equipment and appliances • Crimes require higher level of skill, transport, and access • Property taken when the house securable • Electricity meter inspections are a “real time” indicator of when the house issecurable
Responses • Committee made recommendations to chief • General and targeted approach to responses • Shift and share responsibility with builders
Responses General Responses: • Patterns • Educating victims and guardians • Increase police guardianship • Meet and train builders Targeted Reponses: • Working with specific builders to implement responses
General Response Pattern Identification • Implemented pattern analysis • Developed offender interview questionnaire • Use information to identify problem subcontractors • Provide patterns to builders
General Response Educate Potential Victims and Guardians • Media: Radio, television, newspaper • Community meetings • Utility bill announcement • Crime stoppers
General Response Attend builders meetings • Treasure Coast Builders Association • Provided general crime prevention advice, problem analysis results, and ongoing patterns Security check by officers • Weekly addresses of meter inspections • Report distributed to patrol officers • Addresses in riskiest areas prioritized • Daily checks of the sites • “Crime opportunity forms” were left at sites not secured or with vulnerable property • Building supervisors check individual sites each day • Discussion with builders indicated they were receiving the forms
Targeted Response Focus on Repeat Builders • 20% of the builders victimized account for 70% of the reported crime • Conduct further analysis on selected builders • poor place management practices • lack of guardianship • long delivery and installation windows • carelessness in protecting property • Held meeting builders with high and low crime • Work with the builders to tailor responses based on analysis and experience
Targeted Response Builder meeting: Good Practices • One company has a waiver for banks to sign for responsibility for appliances if they insist on installation too early. • One company requires homeowners to take out builder risk insurance. • One company only works with certain subcontractors. • One company delivers appliances the day before closing. • In its planned communities, one company takes back the master key after the appliances have been installed and only the supervisor has the key. Subsequent subcontractors have to contact that person for entry.
Results: Renar Homes • Number of homes assigned to site supervisor: 25-30 to 15 • Focus on property left on site • Delayed installation of appliances Response Began The spike of four crimes in July 2005 was the result of one offender hitting four houses over one weekend.
Results: Adams Homes • Appliances were the top theft concern • Reduced the time the appliances were installed before closing • Assign a person to check that homes were secured on a daily basis Response Began
Results: Hanover Homes • Pool equipment stolen more often • Installed video surveillance cameras at particular construction sites • Removed the pool equipment and re-installed just before the closing Response Began
Results: Royal Professional Builders • Air conditioning units were stolen more often • Delayed installation of air conditioning units • Implemented stickers in Spanish and English affixed to air conditioning units to increase the perception of risk of being caught.
Results: Royal Professional Builders Response Began
Overall AssessmentJune 2004 – May 2006 Response Period