Download
1 / 16
160 likes | 426 Views
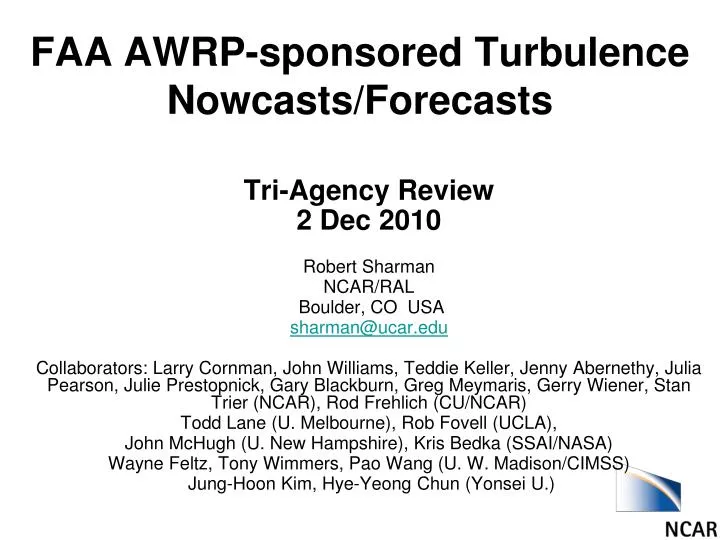
Tri-Agency Review 2 Dec 2010 Robert Sharman NCAR/RAL Boulder, CO USA sharman@ucar.edu Collaborators: Larry Cornman, John Williams, Teddie Keller, Jenny Abernethy, Julia Pearson, Julie Prestopnick, Gary Blackburn, Greg Meymaris, Gerry Wiener, Stan Trier (NCAR), Rod Frehlich (CU/NCAR)

E N D
Tri-Agency Review 2 Dec 2010 Robert Sharman NCAR/RAL Boulder, CO USA sharman@ucar.edu Collaborators: Larry Cornman, John Williams, Teddie Keller, Jenny Abernethy, Julia Pearson, Julie Prestopnick, Gary Blackburn, Greg Meymaris, Gerry Wiener, Stan Trier (NCAR), Rod Frehlich (CU/NCAR) Todd Lane (U. Melbourne), Rob Fovell (UCLA), John McHugh (U. New Hampshire), Kris Bedka (SSAI/NASA) Wayne Feltz, Tony Wimmers, Pao Wang (U. W. Madison/CIMSS) Jung-Hoon Kim, Hye-Yeong Chun (Yonsei U.) FAA AWRP-sponsored Turbulence Nowcasts/Forecasts
FAA turbulence products aimed at IOC • In situ edr data • EDR = ε1/3(m 2/3s-1 ): atmospheric turbulence metric • Data received in near real time fed into 4D data cube • Used in forecast/nowcast products • Turbulence forecast product (Graphical Turbulence Guidance – GTG3) • 3D gridded deterministic output of edr • Clear-air sources including MWT • NWP-based • Turbulence nowcast product (GTGN)-1 • 3D gridded deterministic output of edr • All sources • Observation-based, updated every 15 min • Inputs • In situ data • NTDA2 CONUS mosaic (edr) • DCIT • GTG3 • NOTE all products provide EDR
GTG3 GTG = W1D1* + W2D2* + W3D3* + …. • IOC product: satisfies “Segment 1” requirements as specified in IWP • WRFRR cutout grids (current RUC13 domain) • Upper and midlevels (10,000 ft-FL450) only, no low-levels • Includes CAT, MWT, convection sources not explicitly considered • 1-18 hr forecasts • Uses UAL, DAL, SWA, 767 insitu + PIREPs • Uses deterministic combination of diagnostics • Really a weighted ensemble mean • Ds are related to model spatial variations • Ws are determined from performance metric based on comparisons to 100,000s observations • Regionalized and merged using different diagnostic combinations in different areas, perhaps seasonally • Includes diagnostic-edr PDF mappings
- NVA UBF FRNTGth DTF3 Ellrod1 Ri NCSU1 CLIMO NCSU2 GTG TEMPG EDRS10 VWS GTG =Weighted ensemble of turbulence diagnostics 0 h forecast valid at 22 Sep 2006 15Z 4 4/2/2014
GTG Prob > light Prob > mod Prob > severe Use of indices as ensembles provides confidence values (or uncalibrated probabilities) Red=.75 Red=.30 Red=.30 0 h forecast valid at 22 Sep 2006 15Z
MWT • Funded primarily by NASA ASAP • For WRFRR, based on comparisons to MWT pireps, best discriminators for null vs MOG turbulence are: • Best single 2D diagnostic = Umax (in lowest 1500 m) • Best 3D diagnostics = |wmax| (in lowest 1500m) x some measure of temperature variability at flight level (e.g. |∆T|, CT2, Ri with du/dz from thermal wind) • Different than RUC • Not so good discriminators are • Existence of critical level • PIREPs-derived MWT climatology • Model-produced SGS TKE • Satellite-derived feature detectors may help (UW-CIMSS) • High horizontal resolution should help Nested higher resolution grids Outer domain Lower resolution
Conversion of diagnostics (D) to D*(ε1/3) Assume turbulence in the UTLS has a log normal distribution of ε1/3 Consistent with GASP, research aircraft, and NWP data So rescale diagnostic D to ε1/3 through Where a and b are chosen to give best fit to expected lognormal distribution in the higher ranges PACDEX data 7
GTGN • Output is • deterministic edr (m 2/3 s -1) • updated every 15 min. • Gridded data with same horizontal and vertical resolutions as GTG3 • Includes • “Direct” observations of turbulence from • In situ edr (UAL, DAL, SWA, 767 insitu) • Pireps • NTDA2.5 CONUS mosaic • “Inferences” from • Satellite-derived features from NASA-funded programs • CIT • Possibly MWT • GTG3 analyses, 1 or 2 hr forecasts, including MWT • lightning
GTGN components: PIREPS + in situ turbulence detection of EDR Verbal pilot reports (PIREPS) Aircraft dependent Subjective Position and time inaccuracies Median=98 km, mean=135 km, based on 1400 edr-PIREPs ~ 400/day In situ EDR (= ε1/3 m 2/3s-1 ) measurements Automated: Resides within the avionics system on selected commercial aircraft Aircraft independent measure of turbulence scale 0-1 Currently ~ 5000/hour 100 UAL 757s (reported every min in cruise) 80 DAL 737s (“triggered” + “heartbeats” every 15 min) 10 SWA 737-700s for testing. Planned deployment on ~340 total Both used in GTG/GTGN PIREP EDR
GTGN components (cont.): NTDA (NEXRAD Turbulence Detection Algorithm) EDR EDR scale NEXRAD 2008-08-11 1900, FL360 Uses LII spectral width estimates + extensive QC to measure in-cloud EDR 3-D EDR mosaic of 133 NEXRADs running in real-time at NCAR with 5 min updates
GTGN components (cont.): DCIT Algorithm designed to diagnose regions of in-cloud and near-cloud convectively-induced turbulence (CIT) Uses NWS forecast model data, lightning, NEXRAD, and satellite data along with an empirical model based on in-situ EDR “truth” Funded by FAA, NASA, NOAA Complemented by high resolution computer simulations of CIT events Revealed the importance of gravity waves and gravity wave “breaking” Demonstrated shortcomings of current FAA thunderstorm avoidance guidelines bands 0905 UTC 16 June
Idealized single sounding – animation of w at z=12 km* *Courtesy Rob Fovell UCLA
More sensitivity studies 4 km w/YSU/LFO 4 km w/QNSE/Seifert 1.5 km w/YSU/Seifert 1.5 km w/YSU/LFO
GTGN Example: Components & Output: 20100813 at 22z FL380 GTG2 1hr Fcst In situ, Pireps (1 hr prior) & NTDA GTGN & Next 15min In situ
Research needs/opportunities Need better understanding of turbulence processes For CAT, define the linkage between the large (observable) scales to aircraft scales Turbulent processes within cloud (could increase capacity) This can be accomplished through High resolution numerical simulations of turbulent events have been very instructive Case studies of turbulence encounters (NTSB or airlines) NTDA EDR dBZ
Research needs/opportunities (cont.) Need more and better observations over CONUS and globally Expand insitu measurements (FAA, NASA, industry?) Need nighttime (package carriers), international coverage, with water vapor Need edr -> aircraft loads maps (PIREPs) Develop turbulence climatologies from in situ (e.g., event duration) Profilers? Include onboard radar Use of satellite data to infer turbulence (NASA?) Explore the benefits of higher-resolution e.g., hyperspectral Perform coupled atmospheric/satellite simulations for CIT,MWT Develop NWP optimal NWP model configuration (NOAA, FAA?) R&D better methods for combining diagnostics (FAA?) AI techniques? Ultimately output needs to be probabilistic