Download
1 / 8
90 likes | 188 Views
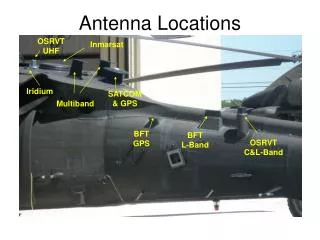
Receive Antenna Performance Comparison. Receive Antenna Monitoring. The receive antenna was installed in its permanent location inside the chamber

E N D
Receive Antenna Monitoring • The receive antenna was installed in its permanent location inside the chamber • A spectrum analyzer was used to monitor the receive antenna, the frequency span set to zero, and the sweep time equal to the time of one full paddle revolution • A known signal was injected into the chamber (this was the same frequency and power as was used during the calibration) and verified with a directional coupler and power meter • The paddlewheel was rotated continuously while the spectrum analyzer took one sweep
Receive Calculations • A calculation of the field strength was made from the peak power sampled across one tuner rotation using the equation below:
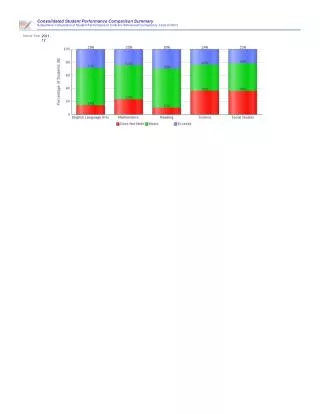
Comparison with E-field probe • The field strength calculated from the peak receive antenna was then compared against the average of the nine peak e-field probe resultants taken during the chamber calibration at that frequency, and a dB delta between the two calculated and shown in the graph below • If the calculated field strength from the receive antenna was lower than the average peak resultant measured, then it is indicated by a negative number, if it was higher, the number is positive • Multiple receive antennas were used to create the comparison in the graphs below
Antenna Selection • Using the data above it was determined the antennas were in general a worst case style of measurement. The only exception being the 400 MHz – 1 GHz range. • The discone antenna demonstrated a closer match to the isotropic probe readings, and it was therefore decided to use the discone antenna for testing. • In all cases, the dB delta of the peaks seen above the e-field probe were within the total error tolerances of the measurement equipment
Receive Antenna Uniformity • The receive antenna calculated peak field was integrated into the uniformity measurements for an evaluation of the impact it will have on the uniformity, for a total of ten measurement points for the uniformity • The results are shown in the graph below