Download
1 / 27
270 likes | 477 Views
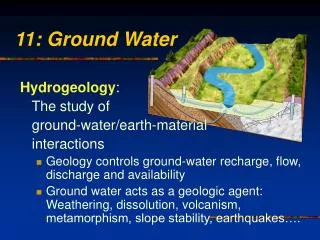
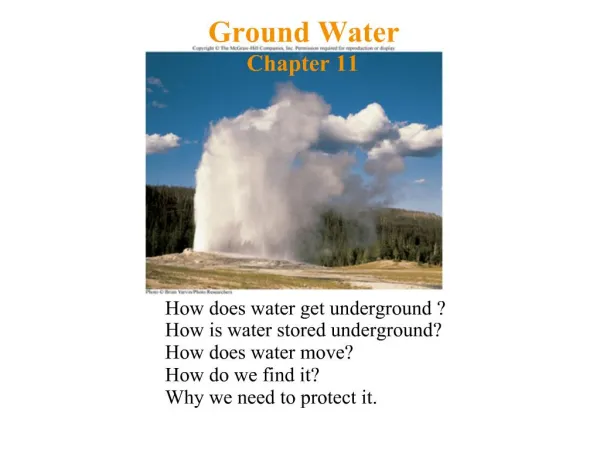
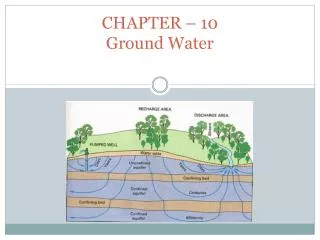
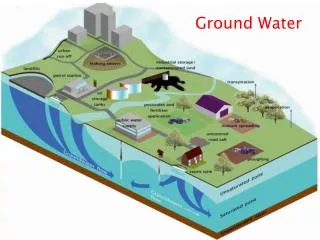
Lake Powell. Water levels are decreasing every year since 1999.. Ground Water. Ground Water lies beneath the ground surface, filling pores in sediments and sedimentary rocks and fractures in other rock types Represents 0.6% of the hydrosphere (35x the water in all lakes and rivers combined)Resupplied by slow infiltration of precipitationCleaner than surface waterAccessed by wells.

E N D
7. FIGURE 11.1 Estimated use of water, by source, in the United States from 1950 to 2000. [Data from U.S. Geological Survey.]
FIGURE 11.1 Estimated use of water, by source, in the United States from 1950 to 2000. [Data from U.S. Geological Survey.]
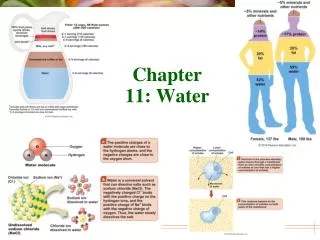
8. FIGURE 11.2 The distribution of water on Earth. [Data from J. P. Peixoto and M. Ali Kettani, �The Control of the Water Cycle.� Scientific American (April 1973): 46; E. K. Berner and R. A. Berner, Global Environment. Upper Saddle River, N.J.: Prentice Hall, 1996, pp. 2�4.]
FIGURE 11.2 The distribution of water on Earth. [Data from J. P. Peixoto and M. Ali Kettani, �The Control of the Water Cycle.� Scientific American (April 1973): 46; E. K. Berner and R. A. Berner, Global Environment. Upper Saddle River, N.J.: Prentice Hall, 1996, pp. 2�4.]
9. FIGURE 11.3 The hydrologic cycle is the movement of water through Earth�s crust, atmosphere, oceans, lakes, and streams. The numbers indicate the amount of water (in thousands of cubic kilometers per year) that flows among these reservoirs annually.
FIGURE 11.3 The hydrologic cycle is the movement of water through Earth�s crust, atmosphere, oceans, lakes, and streams. The numbers indicate the amount of water (in thousands of cubic kilometers per year) that flows among these reservoirs annually.
10. FIGURE 11.7 (a) Average annual precipitation in the United States. [Data from U.S. Department of Commerce, Climatic Atlas of the United States, 1968.] (b) Average annual runoff in the United States. [Data from USGS Professional Paper 1240-A, 1979.]
FIGURE 11.7 (a) Average annual precipitation in the United States. [Data from U.S. Department of Commerce, Climatic Atlas of the United States, 1968.] (b) Average annual runoff in the United States. [Data from USGS Professional Paper 1240-A, 1979.]
11. FIGURE 11.8 The Mississippi River and its tributaries form the largest drainage network in the United States.
FIGURE 11.8 The Mississippi River and its tributaries form the largest drainage network in the United States.