Download
1 / 23
230 likes | 317 Views
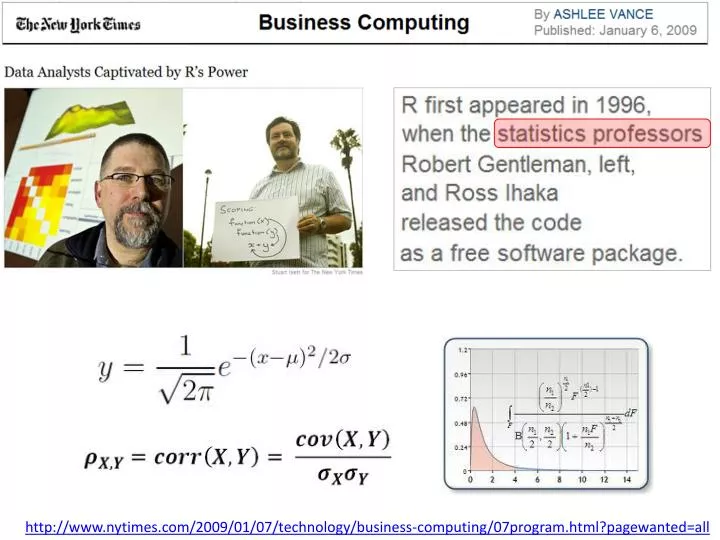
http://www.nytimes.com/2009/01/07/technology/business-computing/07program.html?pagewanted=all. Workspace Fewer Lines of Code Efficiency Capability. Package Code Documentation Datasets. Source Code Tons of Lines of Code Simplified.

E N D
http://www.nytimes.com/2009/01/07/technology/business-computing/07program.html?pagewanted=allhttp://www.nytimes.com/2009/01/07/technology/business-computing/07program.html?pagewanted=all
Workspace • Fewer Lines of Code • Efficiency • Capability • Package • Code • Documentation • Datasets • Source Code • Tons of Lines of Code Simplified
The next data visual was produced with about 150 lines of R code
R Installation Already Includes Several Libraries Workflow Data Analysis Goals Input a Comma Separated Values Data Input Enter Manually Data Management Combine Variables Add Variable Select a Subset Statistics & Analysis Visualization & Reporting
Integrated Development Environment (IDE) • Write Code/ Program • Input Data • Analyze • Graphics Datasets, etc. Enter Commands View Results
The R Graphics Package library(help="graphics") • Graphing Parameters • Basic Chart Types Titles X-Axis Title Y-Axis Title Legend Scales Color Gridlines
Currently, how many R Packages? At the command line enter: • dim(available.packages()) • available.packages()
Correlations Matrix library(car) scatterplotMatrix(h)
ggplot2 In ggplot2 a plot is made up of layers. Pl o t
Data Structures character vector numeric vector Dataframe: d <- c(1,2,3,4)e <- c("red", "white", "red", NA)f <- c(TRUE,TRUE,TRUE,FALSE)mydata <- data.frame(d,e,f)names(mydata) <- c("ID","Color","Passed") List: w <- list(name="Fred", age=5.3) Numeric Vector: a <- c(1,2,5.3,6,-2,4) Character Vector: b <- c("one","two","three") Framework Source: Hadley Wickham Matrix: y<-matrix(1:20, nrow=5,ncol=4)
Actor Heights Create Vectors of Actor Names, Heights, Date of Birth, Gender 2) Combine the 4 Vectors into a DataFrame
Variable Types • Numeric: e.g. heights • String: e.g. names • Dates: “12-03-2013 • Factor: e.g. gender • Boolean: TRUE, FALSE
Creating a Character / String Vector • We use the c() function and list all values in quotations so that R knows that it is string data. • Create a variable called ActorNamesas follows: ActorNames <- c(“John", “Meryl”, “Jennifer", “Andre")
Class, Length, Index class(ActorNames) length(ActorNames) ActorNames[2]
Creating a Numeric Vector / Variable • Create a variable called ActorHeights(inches): ActorHeights <- c(77, 66, 70, 90)
Creating a Date Variable • Use the as.Date() function: ActorDoB <-as.Date(c("1930-10-27", "1949-06-22", "1990-08-15", "1946-05-19“ )) • Each date has been entered as a text string (in quotations) in the appropriate format (yyyy-mm-dd). • By enclosing these data in the as.Date() function, these strings are converted to date objects.
Creating a Categorical / Factor Variable • Use the factor() function: ActorGender <- c(“male", “female", “female", “male“ ) ActorGender <- factor(ActorGender)
Vectors and DataFrames Actor.DF <-data.frame(Name=ActorNames, Height=ActorHeights, BirthDate = ActorDob, Gender=ActorGender) dim(Actor.DF) Actor.DF[2] Actor.DF[2,] Actor.DF[1,3] Actor.DF[2,2] Actor.DF[2:3,]
getwd() setwd() > getwd() [1] "C:/Users/johnp_000/Documents" > setwd()
Write / Create a File • write.table(Actors.DF, “ActorData.txt", sep="\t", row.names = TRUE) • write.csv(Actors.DF, “ActorData.csv")