Download
1 / 62
630 likes | 835 Views
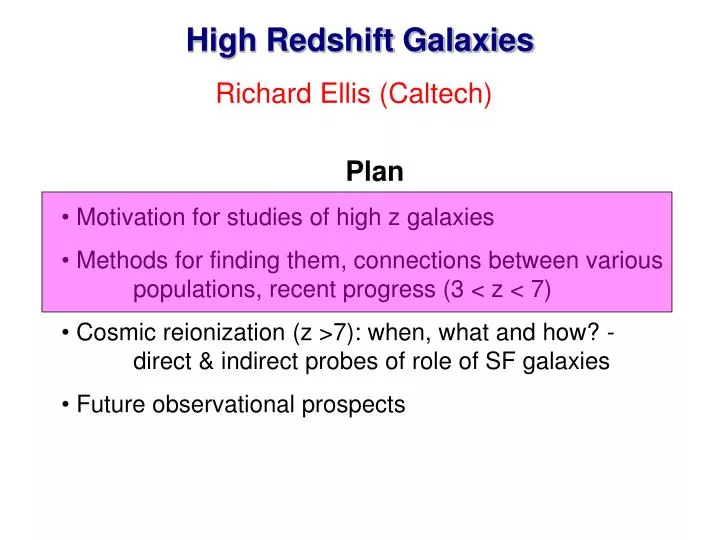
High Redshift Galaxies. Plan Motivation for studies of high z galaxies Methods for finding them, connections between various populations, recent progress (3 < z < 7) Cosmic reionization (z >7): when, what and how? - direct & indirect probes of role of SF galaxies

E N D
High Redshift Galaxies • Plan • Motivation for studies of high z galaxies • Methods for finding them, connections between various populations, recent progress (3 < z < 7) • Cosmic reionization (z >7): when, what and how? - direct & indirect probes of role of SF galaxies • Future observational prospects Richard Ellis (Caltech)
Importance of High z Data Our understanding of the local population of galaxies is largely confined to its spatial distribution and (perhaps) some environmental trends in the broadest sense Standard model needs major `additional ingredients’ to reconcile local color and luminosity distributions: such effects have major implications for assembly and SF histories; this motivates studies of sources with z > 1 Census of earliest objects (z > 7) addresses issues related to cosmic reionization and feedback in low mass halos - areas where theoretical predictions are very uncertain Introduce four key galaxy populations whose studies are relevant I: Lyman break galaxies: color-selected star forming galaxies z > 2 II: Sub-mm galaxies located via redshifted dust emission III: Various passively-evolving sources selected via deep IR data IV: Lyman alpha emitters: sources selected via narrow-band imaging or spectroscopy
Lyman Break Galaxies Effect of neutral hydrogen The Lyman continuum discontinuity is particularly powerful for isolating star-forming high redshift galaxies. From the ground, we have access to the redshift range z=2.5-6 in the 0.3-1 micron range. Steidel et al 1999 Ap J 462, L17 Steidel et al 1999 Ap J 519, 1 Steidel et al 2003 Ap J 592 728
Photometric Cuts: Predictions and Practice Real Data (10’ field) Expectations Spectral energy distributions allow us to predict where distant SF galaxies lie in color-color diagrams such as (U-G vs G-R) (Steidel et al 1996)
Sub-mm Star Forming Sources 15m JCMT SCUBA array Sub-mm astronomers SCUBA: 850m array detects dusty star forming sources: - behind lensing clusters (Smail et al Ap J 490, L5, 1997) - in blind surveys (Hughes et al Nature 394, 211, 1998) Source density implies 3 dex excess over no evolution model based on density of local IRAS sources: Key question is what is the typical redshift, luminosity and SF rate?
Negative k-correction for sub-mm sources K-correction is the dimming due to the (1+z) shifting of the wavelength band (and its width) for a filter with response S() In the Rayleigh-Jeans tail of the dust blackbody spectrum, galaxies get brighter as they are redshifted to greater distance Blain et al (2002) Phys. Rept, 369,111
Radio Identification of Sub-mm Sources SCUBA sources often have no clear optical counterpart, so search with VLA & OVRO L ~ 1013 L if z~2 Could be as important as the UV Lyman break population Frayer et al (2000) AJ 120, 1668
Spectra of Radio-Detected SCUBA Sources • VLA positions for 70% of f(850m) > 5 mJy (20% b/g) • Slits placed on radio positions (22 < I < 26.5) with Keck • 10-fold increase in number of SCUBA redshifts (LRIS-B) Chapman et al (2003) Nature 422, 695 Chapman et al (2005) Ap J 622, 722
Sub-mm and Lyman Break Galaxies are Co-eval 2003 2005 • 50% completeness with LRIS-B and radio selection limits • Radio-selected sub-mm sources 20% of background • Most sub-mm sources have z < 4 • Peak z = 2.4 – comparable to that for AGN • Although (LBG) 10 (SCUBA), luminosity/SF densities comparable
Passively-Evolving Galaxies • LBGs and sub-mm are both star forming sources • Arrival of panoramic IR cameras opens possibility of locating non-SF (or dusty) galaxies at high z • Termed variously: • Extremely Red Objects • Distant Red Galaxies • depending on selection criterion. for z ~ 1-2: select on I-H colour for z > 2: select on J-K colour Such objects would not be seen in the Lyman break samples
Objects with J-K > 2.3 Surprisingly high surface density: • ~0.8/arcmin to K=21 (two fields) • ~2/arcmin to K=22 (HDF-S) • ~3/arcmin to K=23 (HDF-S) 2 2 2 2 van Dokkum,Franx, Rix et al
Keck Spectroscopy (van Dokkum et al) Z=2.43 Z=2.43 Z=2.43 Z=2.71 Z=3.52
Absorption Line Spectroscopy (Gemini GNIRS) Now practical (but slow) to secure redshifts for K-limited samples using low resolution JHK GNIRS spectrograph 20 z > 2 massive galaxies of which ~half are quiescent (Kriek et al 2006)
Lyman Alpha Emitters Origin: ionizing flux absorbed by H gas Ly photons (as in Galactic HII regions) Efficient: < 6-7% of total radiation may emerge in Ly depending on IMF, metallicity etc; better contrast against sky background 1 M yr-1 = 1.5 1042 ergs sec-1 (Kennicutt 1998) Complementary techniques (z>6): - narrow band (f< 10-17 cgs, SFR~3 M yr-1, V~2. 105 Mpc3) - lensed spectra (f< 3.10-19, SFR~0.1 M yr-1, V <50 Mpc3)
Panoramic Imaging Camera on Subaru 8 meter Suprime-Cam Megacam Suprime Cam: 10 CCDs, 34 27 arcmin FOV (upgraded to deep depletion devices in 2008) Coming soon.. HyperSuprime Cam: 1.5 deg FOV
Narrow Bands in `Quiet’ Windows in Sky Spectrum Airglow spectrum z(L) = 4.7 5.7 6.6 6.9 NB: Requires panoramic imaging as z range is small
Selection & Spectroscopic Verification Compare signal in nb filter with broad-band signal using Subaru bb-nb 5007Å 3727Å Spectroscopic follow-up of candidates with Keck 1216Å Hu et al (2003) z=5.7 survey
Cosmic Star Formation History Standardize observations (cosmology, extinction, incompleteness) Fit parametric form to star formation history and integrate Predicts local stellar mass density * (z=0) in absolute units from 2dF Star formation history Mass assembly history Cole et al 2dF GALEX, SDSS UV ACS dropouts Spitzer FIR • Data suggests half the local mass in stars is in place at z~2 0.2 • Major uncertainties are IMF and luminosity-dependent extinction Hopkins & Beacom Ap J 651, 142 (2006)
Unified View of the Various Populations • Integrating to produce a comoving cosmic SFH dodges the important question of the physical relevance of the seemingly diverse categories of high z galaxies (e.g. LBGs, sub-mm, DRGs, LAEs). • Given they co-exist at 1<z<3 what is the relationship between these objects? • Key variables: • - basic physical properties (masses, SFRs, ages etc) • relative contributions to SF rate at a given redshift • degree of overlap (e.g. how many sub-mm sources are LBGs etc) • spatial clustering (relevant to bias) Some recent articles: van Dokkum et al Ap J 638, L59 (2006); Papovich et al Ap J 640, 92 (2006); Reddy et al Ap J 644, 792 (2006); Gawiser et al Ap J 642, L13 (2006) Grazian et al (astro-ph/0701.233)
Clustering of Lyman Break Galaxies UV bright galaxies at z~3 are clustered nearly as strongly as bright galaxies in the present Universe. Of what population are they the progenitors? What are the masses of these galaxies (both dark and stellar)? Adelberger et al (1998) demonstrated strong clustering of LBGs consistent with their hosting massive DM halos perhaps as progenitors of massive ellipticals (Baugh et al 1998)
Luminosity Function at z~3 Local LF • Key to physical nature of LBGs is origin of intense SF. Is it: • prolonged due to formation at z~3 (Baugh et al 1998) • temporary due to merger-induced star burst (Somerville et al 2001) Shapley et al 2001 Ap J 562, 95
Properties of Lyman Break Galaxies (z~3) <M*> = ~2 x 10¹⁰ M <age> = 320 Myr @ z = 3 <SFR> ~ 45 M yr-1 <E(B-V)> =0.15 AUV~1.7 ~5 Extinction correlates with age– young galaxies are much dustier SFR for youngest galaxies average 275 M yr-1 ; oldest average 30 M yr-1 Objects with the highest SFRs are the dustiest objects Shapley et al 2001 Ap J 562, 95
Composite Spectra: Young versus Old • Young LBGs also have much weaker Ly emission, stronger interstellar absorption lines and redder spectral continua • Galaxy-scale outflows (“superwinds”), with velocities ~500 kms s-1, are present in essentially every case examined in sufficient detail Shapley et al 2001 Ap J 562, 95
Lyman Break Galaxies: Summary • Period of elevated star formation (~100’s M yr-1) for ~50 Myr with large dust opacity (sub-mm galaxy overlap) • Superwinds drive out both gas and dust, resulting in more quiescent star formation (10’s M yr-1) and smaller UV extinction • Quiescent star formation phase lasts for at least a few hundred Myr; by end at least a few 1010 M of stars have formed • All phases are observable because of near-constant far-UV luminosity Q: How is this LBG-submm connection viewed from the sub-mm point of view? Q: Where do massive red galaxies fit into the picture?
Clustering of Sub-mm Galaxies Angular correlation function Correlation length r0 Tentative evidence for stronger clustering than LBGs (but N=73 cf. N>1000 LBGs!) suggesting more massive subset in dense structures Blain et al 2004 Ap J 611, 725
Massive Red Galaxies at z~2 Coadded spectrum of z~1.5 red galaxies R-K Redshift • 20 red galaxies z~1.5, age 1.2 - 2.3 Gyr, zF=2.4 - 3.3 • Progenitors have SFRs ~ 300-500 M yr-1 (sub-mm gals?) Glazebrook et al Nature 430, 181 (2004) McCarthy et al Ap J 614, L9 (2004)
Distinguishing Between LBGs and LAEs Key question for z>5 studies is relationship between Lyman break & Ly emitters: do the techniques find similar or different types of sources? Gawiser et al (2006) study of 40 z~3 LAE c.f. various subsamples in larger Shapley et al (2001) LBG study Suggest LAEs are lower mass and less dusty than comparably young LBGs Kashikawa et al (2006) and Overzier et al (2006) provide contrasting views of the clustering of LBGs and LAEs at z~6 consistent with LAEs being in lower mass halos Composite SED of z~3 LAE
Evolution 3 < z < 7: What to Believe? • How effective are the various high z selection methods? - L*(z=6) i~26 where spectroscopy is hard - spectroscopic samples biased to include strong L - great reliance on photometric redshifts • Is there a decline in the UV luminosity density 3<z<6? - results are in some disagreement - differing trends in continuum drops & L emitters • Is the observed UV at z>6 sufficient for reionization? - contribution from (unobserved) faint end of LF? - unusual popns: intense EW(L), steep UV continua? • Significant stellar masses for post-burst z~6 galaxies - how reliable are the stellar masses? - inconsistent with declining SF observed 6<z<10? - does this imply an early intense period of activity?
Lyman breaks or `dropouts’ at higher z z-dropout Stanway et al (2003) Traditional dropout technique poorly-suited for z > 6 galaxies: - significant contamination (cool stars, z~2 passive galaxies) - spectroscopic verification impractical below ~few L* i-drop volumes: UDF (2.6 104), GOODS-N/S (5.105), Subaru (106) Mpc3 flux limits: UDF z<28.5, GOODS z<25.6, Subaru z<25.4
Contamination from z~2 Passive Galaxies Addition of a precise optical-infrared color (z - J) can, in addition to the (i - z) dropout cut, assist in rejecting z~2 passive galaxy contaminants. (Stanway et al 2004) (i – z) 5.7 < z < 6.5 z~2 passive galaxies This contamination is ~10% at z~25.6 but is negligible at UDF limit (z~28.5) (z – J)
Contamination by Galactic dwarfs - more worrisome UDF z<25.6 (Stanway et al 2004) L dwarfs E/S0 HST half-light radius Rh more effective than broad-band colors Contamination at bright end (z<25.6) is significant (30-40%)
Keck spectroscopy of i-drops: 10.5 hrs zAB < 25.6 z=5.83 L L-dwarfs contaminate at bright end
Counts for i-band drops (GOODS+UDF) GOODS UDF 6 from z~3 Spec limit GOODS/UDF data to zAB=28.5 consistent with z=3 LBG LF but 6 Bunker, Stanway, Ellis & McMahon MNRAS 355, 374 (2004)
Declining UV luminosity density of dropouts Bouwens & Illingworth (2006) Bouwens et al (astro-ph/0707.2080) Rapid decline in UV luminosity density 3<z<7 Increased fraction of low luminosity galaxies at high z
What is Physical Cause of this Evolution? Stark, Loeb & Ellis (astro-ph/0701.882) z = 4,5,6,7 • Bouwens et al (astro-ph/0707.2080) claim: • primary evolution is a shift in M* (0.7 mag in 0.7 Gyr over 4<z<6) • change in shape of LF less secure (but =-1.7 is very steep) • evolution explained by various semi-analytic models driven by halo mergers
Confirmation from Subaru • HST offers superior photometry & resolution (important for stellar contamination) but SuPrimeCam has much bigger field (each pointing = 2 GOODS-N+S) • Additional photometric bands developed to sort stellar contamination • Shioya et al (2005): used intermediate band filters @ 709nm, 826nm to estimate stellar contamination in z~5 and z~6 samples respectively • Shimasaku et al (2005) split z-band into two intermediate filters zB, zR to measure UV continuum slope • Yoshida et al (2006): comprehensive survey of B, V and R drops in Subaru Deep Field These studies confirm LBG trends indicated via HST studies
Evolution of Lyman Break Galaxy LF (Subaru) • Subaru deep field (875 arcmin2) • not as sensitive to faint end but supports steep • primary evolution over 4<z<6 is in M* Yoshida et al 2006 Ap J 653, 988
Independent Confirmation from Spitzer Verma et al (astro-ph/0701.725): 21 V-drops with clean IRAC detections enabling ages and stellar masses for comparison with samples at z~3
Stellar Masses & Ages: Comparing z~5 & z~3 LBGs z~5 z~3 z~3 z~5 For similarly-luminous LBGs, those at z~5 are younger and less massive than at z~2 Verma et al (astro-ph/0701.725)
Subaru Rules the Waves for Ly Emitters! Large scale structure from 515 Ly emitters at z=5.7 Ouchi et al 2005 Ap J 620 L1
Latest Subaru Results: 3.1 < z < 5.7 • 858 LAEs over 1 deg2 • 84 spectroscopically-confirmed • No evolution in L* or • Contrasts with LBG evolution suggests LAEs are a more dominant population at early times Ouchi et al astro-ph/0707.3161
Lyman alpha emission: n=21, E=10.199eV, 1216Å • Resonant transition: • foreground H gas cloud scatters away Ly photons in direction and frequency • in partly ionized IGM, scattering is maximum at 1216Å in rest-frame of gas cloud - affects blue side of observed line • in fully neutral IGM, scattering far from resonance can occur - damping wings • As a result many workers have stressed the importance of monitoring evolution in the Ly LF and the line profile Lyman Alpha Emission and the IGM Miralda-Escude 1998 Ap J 501, 15 Haiman 2002 Ap J 576, L1 Barkana & Loeb 2004 Ap J 601, 64 Santos 2004 MNRAS 349, 1137
Ly LF: Effective Indicator of Reionization? • Ly damping wing is absorbed by HI and thus valuable tracer of xHI(Miralda-Escude 1998) • In weaker systems, such as those found via strong lensing, Ly may be a sensitive probe of reionisation • Might expect to see abrupt change in LF at the time when reionization ends NB-limit Lensed limit
No Evolution in Ly LF 5.7 < z < 6.5? no data lensed emitters • No evolution suggestsxHI < 0.3 (Malhotra & Rhoads 2004 Ap J 617, L5), but: • small dynamic range of data limits utility of test • realistic models of ionized spheres suggest weaker constraint (Furlanetto et al 2005) indicating strong emitters will persist until xHI ~ 0.5
Subaru View of Ly Emitters 5.7 < z < 6.5 Sudden decline seen in the LF of Ly over a surprisingly small redshift interval! Result remains controversial. Although originally claimed a signature of reionization, most likely due to growth of halo mass function or affected by cosmic variance (Dijkstra et al 2006) Kashikawa et al (2006)
Key Issue: Relationship between LBGs & LAEs Many papers with marginal datasets! Dow-Hygelund et al (astro-ph/0612.454); Finkelstein et al (astro-ph/0612.511); Kovac et al (astro-ph/0706.0893); Pentericci et al (astro-ph/0703.013); Pirzkal et al (astro-ph/0612.513) Tentative conclusions so far: LAEs are younger, smaller, less massive, less clustered than LBGs and an increasing fraction of the SF density at higher z Other issues: Do LAE’s contain `pristene’ Pop III stars? - Claims for `anomalously high’ equivalent widths (marginal) - Searches for He II emission (high ionization line expected in populations with steep IMF) - none seen
EW distributions More on Ly Emitters… LAEs less clustered than LBGs r0 z Ouchi et al (astro-ph/0707.3161) Kovac et al (astro-ph/0706.0893)
What About Passive Objects at z~5-6? • IR arrays revealed significant new population of DRGs at z~2-3 • Is our census at z~5-6 based on LBGs and LAEs complete? • Spitzer is being used to locate potential passive populations at z~5-7 • - Balmer break galaxies (Mobasher et al 2005 Ap J 635, 832) (Wiklind et al, in prep) • - Color-selected samples (Rodighiero et al astro-ph/0704.276) • Problem is lack of spectroscopic confirmation and confusion with lower z interlopers • If many of the proposed candidates are really high z, life will become interesting! • - short duty cycle of SF (expect many in `off’ state) • - large amount of established stellar mass at z~5-6 (t=1 Gyr)