Download
1 / 54
540 likes | 671 Views
Debugging and Hacking the User in Visual Analytics. Remco Chang Assistant Professor Tufts University. “The computer is incredibly fast, accurate, and stupid. Man is unbelievably slow, inaccurate, and brilliant. The marriage of the two is a force beyond calculation .” -Leo Cherne , 1977

E N D
Debugging and Hacking the User in Visual Analytics Remco Chang Assistant Professor Tufts University
“The computer is incredibly fast, accurate, and stupid. Man is unbelievably slow, inaccurate, and brilliant. The marriage of the two is a force beyond calculation.” -Leo Cherne, 1977 (often attributed to Albert Einstein)
Work Distribution Data Manipulation Storage and Retrieval Bias-Free Analysis Prediction Logic Perception Creativity Domain Knowledge Crouser et al., Balancing Human and Machine Contributions in Human Computation Systems. Human Computation Handbook, 2013 Crouser et al., An affordance-based framework for human computation and human-computer collaboration. IEEE VAST, 2012
Visual Analytics = Human + Computer • Visual analytics is “the science of analytical reasoning facilitated by visual interactive interfaces.”1 Interactive Data Exploration Automated Data Analysis Feedback Loop • Thomas and Cook, “Illuminating the Path”, 2005. • Keim et al. Visual Analytics: Definition, Process, and Challenges. Information Visualization, 2008
Example Visual Analytics Systems • Political Simulation • Agent-based analysis • With DARPA • Wire Fraud Detection • With Bank of America • Bridge Maintenance • With US DOT • Exploring inspection reports • Biomechanical Motion • Interactive motion comparison Crouser et al., Two Visualization Tools for Analysis of Agent-Based Simulations in Political Science. IEEE CG&A, 2012
Example Visual Analytics Systems • Political Simulation • Agent-based analysis • With DARPA • Wire Fraud Detection • With Bank of America • Bridge Maintenance • With US DOT • Exploring inspection reports • Biomechanical Motion • Interactive motion comparison R. Chang et al., WireVis: Visualization of Categorical, Time-Varying Data From Financial Transactions, VAST 2008.
Example Visual Analytics Systems • Political Simulation • Agent-based analysis • With DARPA • Wire Fraud Detection • With Bank of America • Bridge Maintenance • With US DOT • Exploring inspection reports • Biomechanical Motion • Interactive motion comparison R. Chang et al., An Interactive Visual Analytics System for Bridge Management, Journal of Computer Graphics Forum,2010.
Example Visual Analytics Systems • Political Simulation • Agent-based analysis • With DARPA • Wire Fraud Detection • With Bank of America • Bridge Maintenance • With US DOT • Exploring inspection reports • Biomechanical Motion • Interactive motion comparison R. Chang et al., Interactive Coordinated Multiple-View Visualization of Biomechanical Motion Data, IEEE Vis (TVCG) 2009.
How does Visual Analytics work? Keyboard, Mouse, etc • Types of Human-Visualization Interactions • Word editing (input heavy, little output) • Browsing, watching a movie (output heavy, little input) • Visual Analysis (collaboration, closer to 50-50) • Question: • Can I hack the user’s brain by analyzing the interactions? Input Visualization Human Output Images (monitor)
Research Statement “Reverse engineer” the human cognitive black box • Debugging the User • Reasoning and intent • Individual differences and analysis behavior • Hacking the User • Extract user’s knowledge • Influencing a user’s behavior (priming) • Use these techniques for “good” • Adaptive and augmented visualizations R. Chang et al., Science of Interaction, Information Visualization, 2009.
1. Debugging the User What is in a User’s Interactions?
What is in a User’s Interactions? • Goal: determine if a user’s reasoning and intent are reflected in a user’s interactions. Grad Students (Coders) Compare! (manually) Analysts Strategies Methods Findings Guesses of Analysts’ thinking Logged (semantic) Interactions WireVis Interaction-Log Vis
What’s in a User’s Interactions • From this experiment, we find that interactions contains at least: • 60% of the (high level) strategies • 60% of the (mid level) methods • 79% of the (low level) findings R. Chang et al., Recovering Reasoning Process From User Interactions. CG&A, 2009. R. Chang et al., Evaluating the Relationship Between User Interaction and Financial Visual Analysis. VAST, 2009.
What’s in a User’s Interactions • Why are these so much lower than others? • (recovering “methods” at about 15%) • Only capturing a user’s interaction in this case is insufficient.
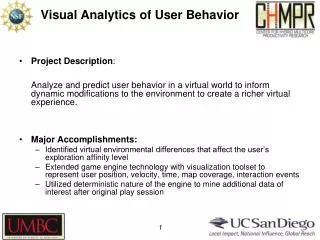
2. Learning about a User in Real-Time Who is the user, and what is she doing?
Task: Find Waldo • Google-Maps style interface • Left, Right, Up, Down, Zoom In, Zoom Out, Found
User Modeling • Collect three types of data about the user in real-time • Physical mouse movement • Mouse position, velocity, acceleration, angle change, distance, etc. • Interaction sequences • Sequences of button clicks • 7 possible symbols • Data state information • Which “chunk” of data the user looked at • Transitioning between the data chunks • Goal: Predict if a user will find Waldo within 500 seconds Helen Zhao et al., Modeling user interactions for complex visual search tasks. Poster, IEEE VAST , 2013. Brown and Ottley et al., Title: TDB. IEEE VAST, In Preparation.
Pilot Visualization – Completion Time Fast completion time Slow completion time
Analysis 2: Interaction Sequences • Uses a combination of n-grams and decision tree
Pilot Visualization – Locus of Control* Internal Locus of Control External Locus of Control Ottley et al., How locus of control influences compatibility with visualization style. IEEE VAST , 2011. Ottley et al., Understanding visualization by understanding individual users. IEEE CG&A, 2012.
Detecting User’s Characteristic • We can detect a faint signal on the user’s personality traits…
Implications • Allows prediction in real-time • N-gram + DT gives us a glimpse into what makes a user [fast|slow], [neurotic|not], etc.
3. Hacking the User What information can I extract out of the user’s brain?
1. Richard Heuer. Psychology of Intelligence Analysis, 1999. (pp 53-57)
Metric Learning • Finding the weights to a linear distance function • Instead of a user manually give the weights, can we learn them implicitly through their interactions?
Metric Learning • In a projection space (e.g., MDS), the user directly moves points on the 2D plane that don’t “look right”… • Until the expert is happy (or the visualization can not be improved further) • The system learns the weights (importance) of each of the original k dimensions • Short Video (play)
Dis-Function Optimization: Brown et al., Find Distance Function, Hide Model Inference. IEEE VAST Poster 2011 Brown et al., Dis-function: Learning Distance Functions Interactively. IEEE VAST 2012.
Results • Used the “Wine” dataset (13 dimensions, 3 clusters) • Assume a linear (sum of squares) distance function • Added 10 extra dimensions, and filled them with random values Blue: original data dimension Red: randomly added dimensions X-axis: dimension number Y-axis: final weights of the distance function • Shows that the user doesn’t care about many of the features (in this case, only 5 dimensions matter) • Reveals the user’s knowledge about the data(often in a way that the user isn’t even aware)
4. Influencing the User Can we manipulate the user’s interactions?
Why Studying Interactions is Hard Keyboard, Mouse, etc Input Visualization Human Output Images (monitor)
Observations • Given a complex task, no two users produce the same interaction trails • In fact, at two different times, the same user does not repeat the exact same sequence of actions • Makes sense… but these changes are not purely random
Individual Differences and Interaction Pattern • Existing research shows that all the following factors affect how someone uses a visualization: • Spatial Ability • Cognitive Workload/Mental Demand* • Perceptual Speed • Experience (novice vs. expert) • Emotional State • Personality* • … and more Peck et al., ICD3: Towards a 3-Dimensional Model of Individual Cognitive Differences. BELIV 2012 Peck et al., Using fNIRS Brain Sensing To Evaluate Information Visualization Interfaces. CHI 2013
Priming Emotion on Visual Judgment Harrison et al., Influencing Visual Judgment Through Affective Priming, CHI 2013
Priming Inferential Judgment • The personality factor, Locus of Control* (LOC), is a predictor for how a user interacts with the following visualizations: Ottley et al., How locus of control influences compatibility with visualization style. IEEE VAST , 2011.
Locus of Control vs. Visualization Type • When with list view compared to containment view, internal LOC users are: • faster (by 70%) • more accurate (by 34%) • Only for complex (inferential) tasks • The speed improvement is about 2 minutes (116 seconds)
Priming LOC - Stimulus • Borrowed from Psychology research: reduce locus of control (to make someone have a more external LOC) “We know that one of the things that influence how well you can do everyday tasks is the number of obstacles you face on a daily basis. If you are having a particularly bad day today, you may not do as well as you might on a day when everything goes as planned. Variability is a normal part of life and you might think you can’t do much about that aspect. In the space provided below, give 3 examples of times when you have felt out of control and unable to achieve something you set out to do. Each example must be at least 100 words long.”
Results: Averages Primed More Internal Performance Good External LOC Average LOC Average ->Internal Internal LOC Poor Visual Form Containment List-View Ottley et al., Manipulating and Controlling for Personality Effects on Visualization Tasks, Information Visualization, 2013
5. Work In Progress: Implications and Applications How do I use these techniques for “good”?
Two Example Applications • Adaptive System Input Visualization Human Output Input Visualization Human • Augmented System Output
Adaptive System: Big Data Problem Large Data in a Data Warehouse Visualization on a Commodity Hardware
Problem Statement • Constraint: Data is too big to fit into the memory or hard drive of the personal computer • Note: Ignoring various database technologies (OLAP, Column-Store, No-SQL, Array-Based, etc) • Classic Computer Science Problem…
Work in Progress… • However, exploring large DB (usually) means high degrees of freedom • Goal: Predictive Pre-Fetching from large DB • Collaboration with MIT Big Data Center • Teams: • MIT: Based on data characteristic • Brown: Based on past SQL queries • Tufts: Based on user’s analysis profile • Current progress: developed middleware (ScalaR) Battle et al., Dynamic Reduction of Result Sets for Interactive Visualization. IEEE BigData, 2013.
Augmented System: Bayes Reasoning The probability that a woman over age 40 has breast cancer is 1%. However, the probability that mammography accurately detects the disease is 80% with a false positive rate of 9.6%. If a 40-year old woman tests positive in a mammography exam, what is the probability that she indeed has breast cancer? Answer: Bayes’ theorem states that P(A|B) = P(B|A) * P(A) / P(B). In this case, A is having breast cancer, B is testing positive with mammography. P(A|B) is the probability of a person having breast cancer given that the person is tested positive with mammography. P(B|A) is given as 80%, or 0.8, P(A) is given as 1%, or 0.01. P(B) is not explicitly stated, but can be computed as P(B,A)+P(B,˜A), or the probability of testing positive and the patient having cancer plus the probability of testing positive and the patient not having cancer. Since P(B,A) is equal 0.8*0.01 = 0.008, and P(B,˜A) is 0.093 * (1-0.01) = 0.09207, P(B) can be computed as 0.008+0.09207 = 0.1007. Finally, P(A|B) is therefore 0.8 * 0.01 / 0.1007, which is equal to 0.07944.
Visualization Aids Ottley et al., Visually Communicating Bayesian Statistics to Laypersons. Tufts CS Tech Report, 2012.
Spatial Aptitude Score • High spatial aptitude -> higher accuracy in solving Bayes problems (with visualization) • Could priming help? • Adaptive visual representation? Ottley et al., Title: TBD. IEEE InfoVis, In Preparation