Download
1 / 7
70 likes | 71 Views
Women education plays a very important role in the overall growth of the country. It does not only help in the development of half of the human capital but also improves the standard of living. The progress of the nation or region is shown by the level of education and literacy of its population. Education, particularly among women has been considered as one of the major aspects for socio economic development of the people of a region. Belagavi district is among the rapidly developing districts in Karnataka with respect to socio economic and agricultural development. According to 2011 census, average literacy rate of Belagavi district 73.48 is lower than the average literacy rate of Karnataka state 75.60 . Office of the Registrar General and Census Commissioner, India, 2011 This can be attributed to greater regional disparities throughout Belagavi district in literacy. In this paper, we present Provisional Population Totals of census 2001 and 2011 and examine the extent of literacy disparities at the taluk level. Here, we found that literacy rate in the study area was 64.21 in 2001 which has increased to 73.48 in 2011. We also found that the urban literacy 85.56 is significantly greater than the rural literacy 69.28 which is concurrent to the wider gender disparities from the rural to the urban population. Manjunatha N K | S M Hurakadli "Trends and Levels of Female Literacy in Belagavi District" Published in International Journal of Trend in Scientific Research and Development (ijtsrd), ISSN: 2456-6470, Volume-1 | Issue-5 , August 2017, URL: https://www.ijtsrd.com/papers/ijtsrd2392.pdf Paper URL: http://www.ijtsrd.com/other-scientific-research-area/other/2392/trends-and-levels-of-female-literacy-in-belagavi-district/manjunatha-n-k<br>

E N D
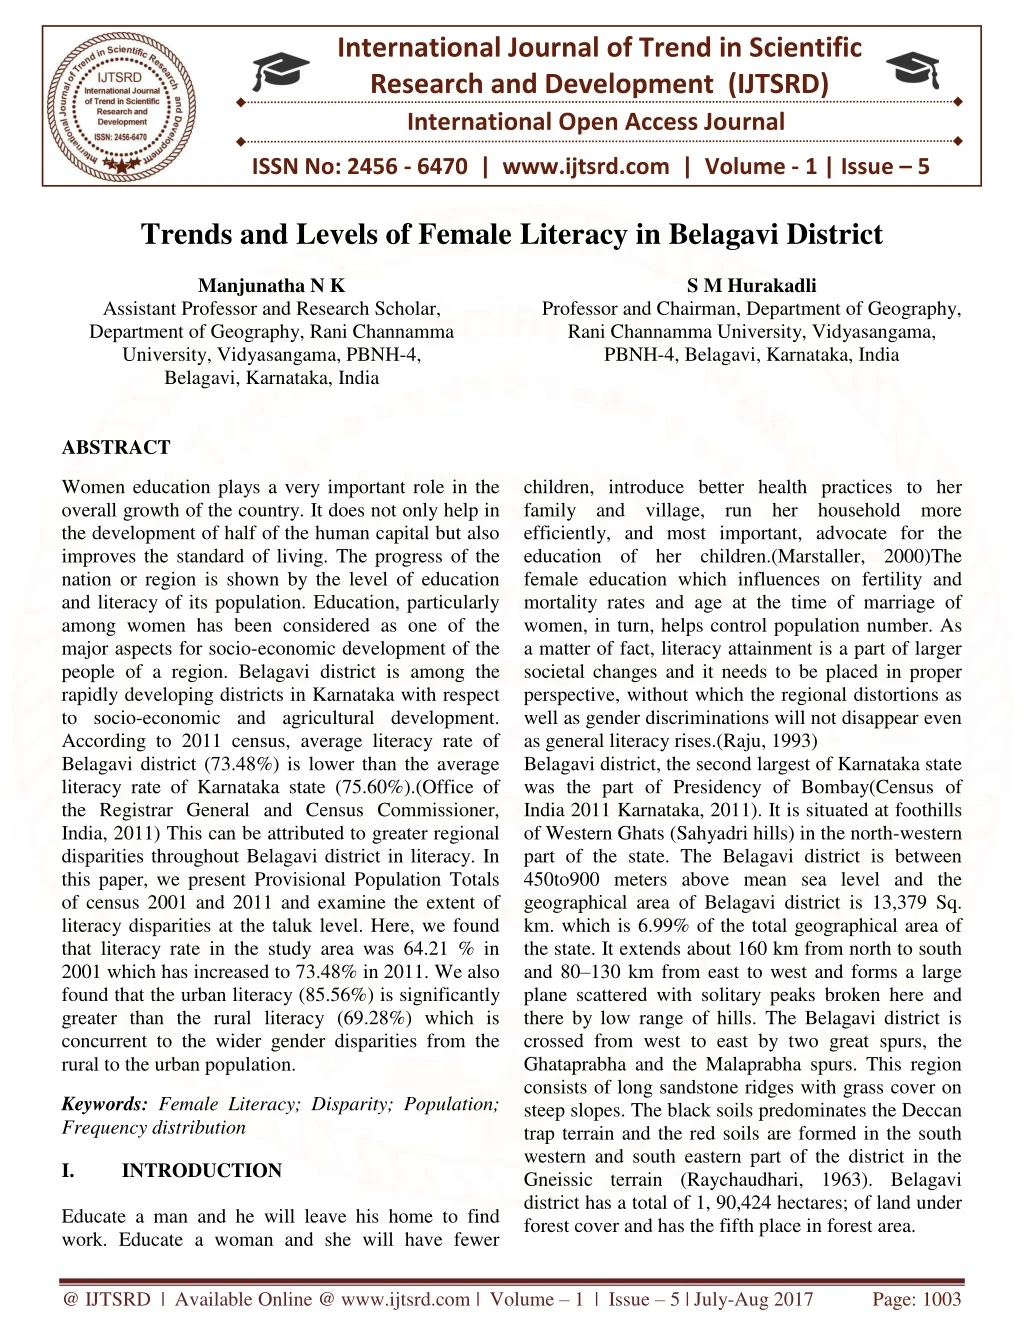
International Journal of Trend in Scientific Research and Development (IJTSRD) International Open Access Journal ISSN No: 2456 - 6470 | www.ijtsrd.com | Volume - 1 | Issue – 5 Trends and Levels of Female Literacy in Belagavi District Manjunatha N K S M Hurakadli Assistant Professor and Research Scholar, Department of Geography, Rani Channamma University, Vidyasangama, PBNH-4, Belagavi, Karnataka, India Professor and Chairman, Department of Geography, Rani Channamma University, Vidyasangama, PBNH-4, Belagavi, Karnataka, India ABSTRACT Women education plays a very important role in the overall growth of the country. It does not only help in the development of half of the human capital but also improves the standard of living. The progress of the nation or region is shown by the level of education and literacy of its population. Education, particularly among women has been considered as one of the major aspects for socio-economic development of the people of a region. Belagavi district is among the rapidly developing districts in Karnataka with respect to socio-economic and agricultural development. According to 2011 census, average literacy rate of Belagavi district (73.48%) is lower than the average literacy rate of Karnataka state (75.60%).(Office of the Registrar General and Census Commissioner, India, 2011) This can be attributed to greater regional disparities throughout Belagavi district in literacy. In this paper, we present Provisional Population Totals of census 2001 and 2011 and examine the extent of literacy disparities at the taluk level. Here, we found that literacy rate in the study area was 64.21 % in 2001 which has increased to 73.48% in 2011. We also found that the urban literacy (85.56%) is significantly greater than the rural literacy (69.28%) which is concurrent to the wider gender disparities from the rural to the urban population. children, introduce better health practices to her family and village, run her household more efficiently, and most important, advocate for the education of her children.(Marstaller, 2000)The female education which influences on fertility and mortality rates and age at the time of marriage of women, in turn, helps control population number. As a matter of fact, literacy attainment is a part of larger societal changes and it needs to be placed in proper perspective, without which the regional distortions as well as gender discriminations will not disappear even as general literacy rises.(Raju, 1993) Belagavi district, the second largest of Karnataka state was the part of Presidency of Bombay(Census of India 2011 Karnataka, 2011). It is situated at foothills of Western Ghats (Sahyadri hills) in the north-western part of the state. The Belagavi district is between 450to900 meters above mean sea level and the geographical area of Belagavi district is 13,379 Sq. km. which is 6.99% of the total geographical area of the state. It extends about 160 km from north to south and 80–130 km from east to west and forms a large plane scattered with solitary peaks broken here and there by low range of hills. The Belagavi district is crossed from west to east by two great spurs, the Ghataprabha and the Malaprabha spurs. This region consists of long sandstone ridges with grass cover on steep slopes. The black soils predominates the Deccan trap terrain and the red soils are formed in the south western and south eastern part of the district in the Gneissic terrain (Raychaudhari, 1963). Belagavi district has a total of 1, 90,424 hectares; of land under forest cover and has the fifth place in forest area. Keywords: Female Literacy; Disparity; Population; Frequency distribution I. Educate a man and he will leave his home to find work. Educate a woman and she will have fewer INTRODUCTION @ IJTSRD | Available Online @ www.ijtsrd.com | Volume – 1 | Issue – 5 | July-Aug 2017 Page: 1003
International Journal of Trend in Scientific Research and Development (IJTSRD) ISSN: 2456-6470 Belagavi district is one of the socio-economically developed districts in Karnataka. Present study is focused on the trends and levels of female literacy in Belagavi District. The average literacy rate of Belagavi district (73.48%) is lower than the average literacy rate of Karnataka state (75.60%) according to 2011 census. As elsewhere in the country, in Belagavi district, the level of female literacy is not only lower than that of the males but also varied in spatial and social terms. II. OBJECTIVES The foremost purpose of this study is to examine the trends and levels of female literacy of Belagavi district during 2001 to 2011. III. STUDY AREA The study area of this paper is a part of Karnataka. The region under study extends from 15°–23’ north to 16°–58’ north latitudes and 74°–05’ east to75°–28’ east longitudes(“Belgaum Dist Gazetteer 1987)The district is divided into 10 taluks for administrative purposes viz., Athani, Belgavi, Chikodi, Gokak, Hukeri, Khanapur, Parasgad (Saundatii), Ramdurg, Raybag and Sampgaon (Bailhongal). Khanapur is the biggest taluk with an area of 1749.3 Sq. km and Raybag is the smallest taluk with an area of 958.8 Sq. km. Belagavi district is bordered by Maharashtra state in the North, Bagalkot district in the East, Dharwad and Uttar Kannada districts in the South, Goa and Maharastra state in the west. The area of the district is 13,415 Sq. km. According to 2011 census the total population of the district is 47, 78,439 with literacy rate 73.48 %. MAP 1- LOCATION MAP OF BELAGAVI DISTRICT IN INDIA IV. DATABASE AND METHODOLOGY The present paper aims to study the trends and levels of female literacy in Belagavi district based on secondary data obtained from district census handbook of Belagavi district, statistical abstracts of Belagavi and Karnataka state and census of India 2011. Other various sources of secondary data have been utilized such as internet and books. Literacy rate has been computed for the population above 6 years. For the measurement of male female disparity in literacy, the Sopher's disparity index (1974) modified by Kundu and Rao (1983) has been employed (Hajare & Ghurake, 2014). FORMULA ??? = ????2 ?1+ ???200 − ?1 200 − ?2+ ⋯ Where, X2 is more than X1. X2= is considered Male. X1=is considered Female V. TRENDS IN LITERACY RATE (INDIA AND KARNATAKA) As per the provisional population totals of Census 2011, literates in India constitute 74% of the total population aged seven and above and illiterates form 26%. Literacy rate has gone up from 64.83% in 2001 to 74.04% in 2011 showing an increase of 9.21 percentage points. The literacy rate for males and females works out to 82.14% and 65.46%, respectively. The increase in literacy rate in males and females during 2001–2011 is in the order of 6.88 and 11.79 percentage points and the literacy rate of Karnataka increased from 66.64% in 2001 to 75.36% in 2011. Among the females, the literacy percentage has increased from 56.87% in 2001 to 68.08%in 2011.The literacy rate of Karnataka is higher than the India’s literacy rate. VI. LITERACY RATE - TRENDS (Belagavi District) According to 2011 census, the average literacy in Belagavi district is 73.48% compared to 61.4% in 2001. The highest literacy rate is 83.68% in Belagavi taluk and lowest literacy rate is 66.36% in Ramdurg taluk, respectively. Leading part of female literacy is found in Belagavi taluk 77.54% followed by Khanapur taluk (66.39%) and lowest literacy of @ IJTSRD | Available Online @ www.ijtsrd.com | Volume – 1 | Issue – 5 | July-Aug 2017 Page: 1004
International Journal of Trend in Scientific Research and Development (IJTSRD) ISSN: 2456-6470 female is found in Raibag taluk 54.94% in 2011. The average literacy of female population in Belagavi district is 64.58% in 2011, compared to 52.30% in 2001 and the female rural literacy of Belagavi district is 59.20% and urban female literacy is 79.95%, respectively. There is a wide gap from average male to female literacy as well as rural (69.28%) to urban literacy (85.56%) in Belagavi district. Table 1- Frequency distribution of districts by levels of female literacy over 2001 and 2011 Female literacy rate Class interval 2001 2011 Up to 40 00 00 08 (Athani, Bailhongal, Gokak, Hukkeri, Khanapur, Ramdurg, Savadatti) 40-55 Raibag, 01 ( Ramdurg) 08 (Athani, Bailhongal, Chikkodi, Gokak, Hukkeri, Khanapur, RaibagSavadatti) 55-70 02 (Belgavi, Chikkodi.) 70 onwards 1( Belagavi) Data sources: Calculated by using data taken from the 2001 and 2011 Population Censuses. Figure 1- Frequency Distribution of Taluks By Levels Of Female Literacy Over 2001 and 2011 censuses FEMALE LITERACY RATE OVER 2001 AND 2011 CENSUSES 9 8 7 No of Taluks 6 5 4 3 2 1 0 Female Literacy Rate 2001 Female Literacy Rate 2011 Up to 40 0 0 40-55 8 1 55-70 2 8 70 onwards 0 1 Class Interval Data sources: Calculated by using data taken from the 2001 and 2011 Population Censuses. Figure 1 presents the frequency distribution of taluks by levels of female literacy over 2001 and2011censuses. As per the Provisional totals of census of India, data are available for Belagavi districts in the country for 2001 and 2011.Table 1 shows the literacy rate among females to be below 40% is zero in any taluks of Belagavi districts in census year2001 and 2011.In the middle level literacy band (40 to 55%), 8 taluks have reduced to 1 taluk (2001-2011). In addition, in the high level of literacy development band (55–70%), there were 2 two taluks in the year 2001, which have increased to 8 taluks in 2011.In the very high literacy development band @ IJTSRD | Available Online @ www.ijtsrd.com | Volume – 1 | Issue – 5 | July-Aug 2017 Page: 1005
International Journal of Trend in Scientific Research and Development (IJTSRD) ISSN: 2456-6470 (70 onwards), there were zero taluks in the year 2001, which have increased to 1 taluk in 2011. Among all the talukas of Belagavi district, Belagavi taluk has highest female literacy rate of 77.54% in 2011. Table 2-Literate Population and Literacy Rate-2001 and 2011 Literate Population-2001 Literate Population-2011 Literacy Rate % 2001 Literacy Rate % 2011 Name of Taluks Total 239507 191258 55244 335278 245330 189455 137260 161035 104939 148776 Male 1381748 115203 312816 200145 152533 115250 81290 98835 66941 94036 Female 92353 76055 239625 135133 92797 74205 55970 62200 37998 54740 Total 320240 243796 710306 421750 350329 248254 172075 231045 146022 208215 Male 182933 137777 386047 121711 201803 140675 97471 132591 86215 238325 Female 137307 106019 324259 183425 148526 107579 74604 98454 59807 86504 Total 61.4 63.37 78.31 68.83 55.9 62.09 65.99 55.68 55.05 56.68 Total 70.42 72.9 83.68 76.06 67.54 71.64 75.65 67.02 66.36 68.64 Male 79.06 81.8 89.63 84.89 77.75 81.21 84.69 75.53 77.53 79.33 Female 61.47 63.87 77.54 67 57.31 62.08 66.39 58.2 54.94 57.69 Male Female Athani Bailhongal Belgavi Chikkodi Gokak Hukkeri Khanapur Raibag Ramdurg Savadatti Belagavi district total Data sources: Calculated by using data taken from the 2001 and 2011 Population Censuses. 72.54 75.44 86.46 81.56 68.7 74.69 78.06 66.62 69.42 71.65 49 50.99 69.71 56.63 42.84 49.15 53.83 44.14 40.36 42.21 230525 9 305203 2 172554 8 144699 94808 1326484 64.20 75.70 52.30 73.48 82.2 64.58 VII. DISPARITY IN MALE /FEMALE LITERACY Belgavi District literacy rate in 2011 is 73.48% where as in 2001 it is 61.4%. The male–female disparity was 0.235 in 2001, while 0.165 in 2011. Table 2 shows that the literacy rate in the study area varied from a minimum of 66.36% in Ramdurg taluk to a maximum of 83.68% in Belagavi taluk of Belagavi district. In the study area the male literacy was 82.2% and for female was 64.58% in 2011. It shows a wide gap of 17.62% literacy from male to female. Table 3 observed that minimum male literacy was in Raibag taluk 75.53% and maximum in Belagavi taluk 89.63% in Belagavi district. There was observed that the minimum female literacy was 54.94% in Ramdurg taluk to a maximum of 77.54% in Belagavi taluk. It shows that there are wide disparities from the male–female literacy rates. As compared to 2001 disparity of literacy decreased by 0.07 % in 2011, because of increased literacy rate. Highest disparity of male and female is observed in Ramdurg taluk (0.223) followed by Savadatti taluk (0.209), because of wide gap from male to female literacy. Lower disparity of literacy in male and female observed in Belagavi taluk (0.108), because, Belagavi taluk of Belagavi District experiences high literacy rate of both in male and female. Figure 2- Disparity of male and female literacy in Belagavi district over 2001 and 2011 DISPARITY OF MALE AND FEMALE LITERACY IN BELAGAVI DISTRICT: 2001- 2011 0.4 Disparity of literacy 0.3 0.2 0.1 Disparity in M/F Literacy… Disparity in M/F Literacy… 0 Name of the Taluks @ IJTSRD | Available Online @ www.ijtsrd.com | Volume – 1 | Issue – 5 | July-Aug 2017 Page: 1006
International Journal of Trend in Scientific Research and Development (IJTSRD) ISSN: 2456-6470 VIII.COMPOSITE INDEX Composite index of disparity is calculated by using the following formula: Composite Index of Disparity =(????????? ?? ???????? 2001 + ????????? ?? ???????? 2011) . 2 A.High Composite Index (Above 0.240) In Belagavi district an average composite index is observed 0.200. There is a wide gap from the higher to the lower composite index in district. In Ramdurg taluk composite index is 0.272 which is highest in district, because of disparity of literacy in this taluk is high i.e. 0.223. In Savadatti taluk composite index is 0.258 and in Gokak taluk (0.241), respectively. Higher composite index includes Ramdurg taluk, Savadatti taluk and Gokak taluk in Belagavi districts. (Figure 3) B.Moderate Composite Index (from 0.200 to 0.240): Moderate composite index ranges from 0.200 to 0.240. In this composite index includes Athani (0.207) Bailhongal(0.207) Chikkodi(0.203) Hukkeri(0.221) Khanapur(0.204) Raibag(0.207) in this six taluks have medium composite index observed, because the same taluks having moderate disparity of literacy (Figure 3) C.Low Composite Index (Below 0.200) Low composite index is below 0.200 is found only in one taluk of Belgavi district, i.e., Belagavi taluk (0.130) because disparity of literacy is lower in this taluk (0.108), respectively (Figure 3). Table 3-Disparity of literacy trend of Belagavi district, 2001-2011 and Composite Index (in percentages) Literacy-2001 Disparity Of Literacy Literacy-2011 Disparity in M/F Literacy Composite index Name of Taluks Male Female Male Female Athani Bailhongal Belagavi Chikkodi Gokak Hukkeri Khanapur Raibag Ramdurg savadatti Belagavi district total 72.54 75.44 86.46 81.56 68.70 74.69 78.06 66.62 69.42 70.47 75.70 49.00 50.99 69.71 56.63 42.84 49.15 53.83 44.14 40.36 42.21 52.30 0.243 0.247 0.153 0.241 0.283 0.262 0.240 0.246 0.322 0.308 0.235 79.06 81.8 89.63 84.89 77.75 81.21 84.69 75.53 77.53 79.33 82.2 61.47 63.87 77.54 67.00 57.31 62.08 66.39 58.2 54.94 57.69 64.58 0.171 0.168 0.108 0.165 0.199 0.181 0.169 0.169 0.223 0.209 0.165 0.207 0.207 0.130 0.203 0.241 0.221 0.204 0.207 0.272 0.258 0.200 Data sources: Calculated by using data taken from the 2001 and 2011 Population Censuses @ IJTSRD | Available Online @ www.ijtsrd.com | Volume – 1 | Issue – 5 | July-Aug 2017 Page: 1007
International Journal of Trend in Scientific Research and Development (IJTSRD) ISSN: 2456-6470 Figure 3- Taluk wise composite index of Belagavi district 0.3 0.25 0.2 0.15 0.1 Composite index 0.05 0 Athan i Bailho ngal Belga vi Chikk odi GokakHukke Khana pur Raiba g Ramd urg savad atti ri Composite index 0.207 0.207 0.13 0.203 0.241 0.221 0.204 0.207 0.272 0.258 Table 4-Literacy rates by sex and their decadal differences between 2001 and 2011, Belagavi district and Taluks. 2011 Decadal difference Name of Taluks 2001 Gender Gap in literacy rate Gender Gap in literacy rate Male Female 49.00 50.99 69.71 56.63 42.84 49.15 53.83 44.14 40.36 42.21 52.30 Male Female Male Female Athani Bailhongal Belagavi Chikkodi Gokak Hukkeri Khanapur Raibag Ramdurg savadatti Belagavi district total Data sources: Calculated by using data taken from the 2001 and 2011 Population Censuses 72.54 75.44 86.46 81.56 68.7 74.69 78.06 66.62 69.42 70.47 75.70 23.54 24.45 16.75 24.93 25.86 25.54 24.23 22.48 29.06 28.26 23.4 79.06 81.8 89.63 84.89 77.75 81.21 84.69 75.53 77.53 79.33 82.2 61.47 63.87 77.54 67.00 57.31 62.08 66.39 58.20 54.94 57.69 64.58 17.59 17.93 12.09 17.89 20.44 19.13 18.3 17.33 22.59 21.64 17.62 6.52 6.36 3.17 3.33 9.05 6.52 6.63 8.91 8.11 8.86 6.50 12.47 12.88 7.83 10.37 14.47 12.93 12.56 14.06 14.58 15.48 12.28 IX. DECADAL VARIATION IN FEMALE LITERACY Increasing female literacy rates, the results are interesting. Belagavi is the slowest as its female literacy rate between 2001 and 2011 increases by 7.83% followed by Chikkodi (10.37%) and Athani (12.47%), whereas high growth in female literacy rate The district level female literacy rate has increased from 52.30% in 2001 to 64.58% in 2011, an increase of 12.28% during the decade. If we look at the performance of individual taluks in terms of @ IJTSRD | Available Online @ www.ijtsrd.com | Volume – 1 | Issue – 5 | July-Aug 2017 Page: 1008
International Journal of Trend in Scientific Research and Development (IJTSRD) ISSN: 2456-6470 is observed in savadatti (15.48%), Ramdurg (14.58%), Gokak (14.47%) and Raibag (14.06%). These are known as highly illiterate taluks achieved significant improvements in literacy among females. Looking at the data in table 4 and trend analysis, we are concluding that the taluks where the overall literacy rate is low, they continue to have large gap in male– female literacy rates even after considerable development in female literacy. National literacy mission and the Sarvasiksha abhiyan both could not achieve target of 75% literacy among females from census year 2001 to census year 2011.The cumulative results shows that from 2001 to 2011 there is marginal increase in female literacy rate in various taluks of Belagavi district which confirms that Government programmes show results but need to be applied efficiently for superior results. REFERENCES A.Male–Female Differential in Literacy rate in the Belagavi District 1)Belgaum Dist Gazetteer 1987 Chp 01.pdf. (n.d.). 2)Census of India 2011 KARNATAKA. (2011). District census handbook Belgaum. 3)Hajare, R. V, & Ghurake, B. B. (2014). Regional disparity in literacy of Kolhapur district, (March), 269–278. 4)Marstaller, B. A. (2000). First Things First: Female Literacy as the Key to Women’s Advancement, (1992), 10–13. 5)Office of the Registrar General and Census Commissioner, India. (2011). Census 2011. Retrieved http://www.census2011.co.in/literacy.php 6)Raju, S. (1993). Nuna, S. C. (ed) Regional disparities in Educational Development, South Asian Publishers Pvt Ltd, New Delhi. 7)Raychaudhari, S. P. (1963). Land resources in india,( vol 1)Indian Commission,New Delhi. The Gender gap in literacy rate in the Belagavi District has declined from 23.4% in 2001 to17.62% in 2011 due to faster increase in literacy among females than male. Subsequently, thegender gap in literacy declined in all the taluks of Belagavidistricts during this period. X. FINDINGS AND CONCLUSION Among 10 taluks of Belagavi district the Ramdurg taluk is having medium level female literacy band of low level of economic development of (40–55%) and desires special attention for improvement in literacy among female. Among 8 taluks of district; Athani, Bailhongal, Chikkodi, Gokak, Hukkeri, Khanapur, Raibag, Savadatti fall under high level of literacy development band (55-70%), even though, The from Soils-Planning @ IJTSRD | Available Online @ www.ijtsrd.com | Volume – 1 | Issue – 5 | July-Aug 2017 Page: 1009