Download
1 / 5
50 likes | 53 Views
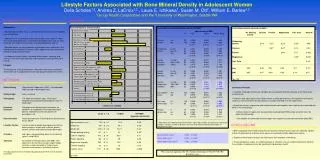
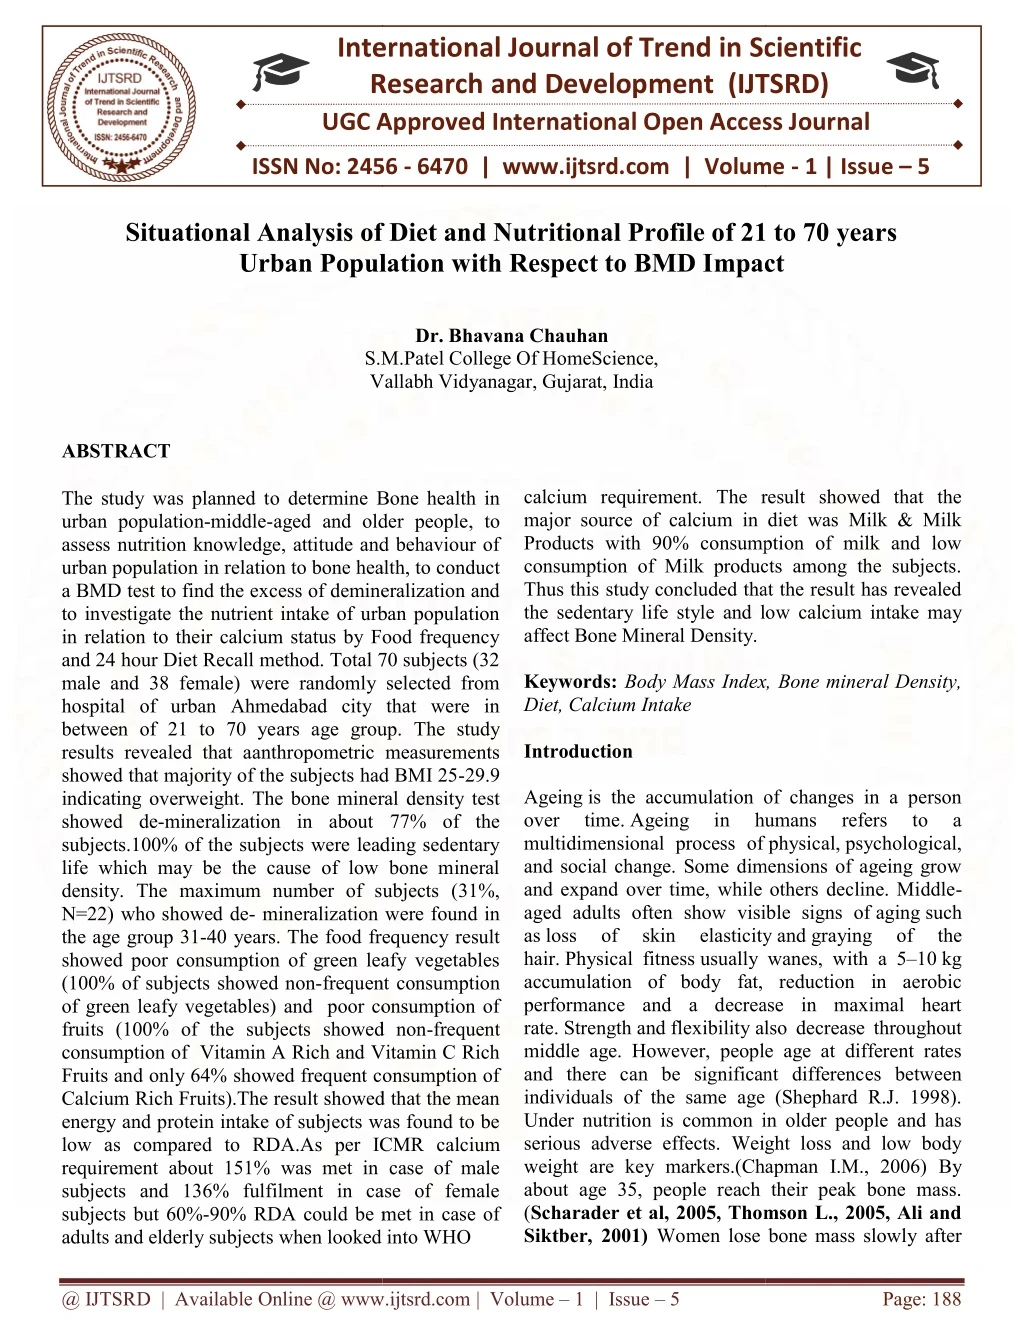
The study was planned to determine Bone health in urban population middle aged and older people, to assess nutrition knowledge, attitude and behaviour of urban population in relation to bone health, to conduct a BMD test to find the excess of demineralization and to investigate the nutrient intake of urban population in relation to their calcium status by Food frequency and 24 hour Diet Recall method. Total 70 subjects 32 male and 38 female were randomly selected from hospital of urban Ahmedabad city who were in between of 21 to 70 years age group. The study results revealed that aanthropometric measurements showed that majority of the subjects had BMI 25 29.9 indicating overweight. The bone mineral density test showed de mineralization in about 77 of the subjects. 100 of the subjects were leading sedentary life which may be the cause of low bone mineral density. The maximum number of subjects 31 , N=22 who showed de mineralization were found in the age group 31 40 years. The food frequency result showed poor consumption of green leafy vegetables 100 of subjects showed non frequent consumption of green leafy vegetables and poor consumption of fruits 100 of the subjects showed non frequent consumption of Vitamin A Rich and Vitamin C Rich Fruits and only 64 showed frequent consumption of Calcium Rich Fruits . The result showed that the mean energy and protein intake of subjects was found to be low as compared to RDA. As per ICMR calcium requirement about 151 was met in case of male subjects and 136 fulfilment in case of female subjects but 60 90 RDA could be met in case of adults and elderly subjects when looked into WHO calcium requirement. The result showed that the major source of calcium in diet was Milk and Milk Products with 90 consumption of milk and low consumption of Milk products among the subjects. Thus this study concluded that the result has revealed the sedentary life style and low calcium intake may affect Bone Mineral Density. Dr. Bhavana Y. Chauhan "Situational Analysis of Diet and Nutritional Profile of 21 to 70 Years Urban Population with Respect to BMD Impact" Published in International Journal of Trend in Scientific Research and Development (ijtsrd), ISSN: 2456-6470, Volume-1 | Issue-5 , August 2017, URL: https://www.ijtsrd.com/papers/ijtsrd2264.pdf Paper URL: http://www.ijtsrd.com/home-science/food-and-nutrition/2264/situational-analysis-of-diet-and-nutritional-profile-of-21-to-70-years-urban-population-with-respect-to-bmd-impact/dr-bhavana-y-chauhan<br>

E N D
International Research UGC Approved International Open Access Journal UGC Approved International Open Access Journal Situational Analysis of Diet and Nutritional Profile of 21 to 70 years opulation with Respect to BMD Impact International Journal of Trend in Scientific Research and Development (IJTSRD) UGC Approved International Open Access Journal Scientific (IJTSRD) ISSN No: 2456 ISSN No: 2456 - 6470 | www.ijtsrd.com | Volume 6470 | www.ijtsrd.com | Volume - 1 | Issue – 5 Situational Analysis of Diet and Nutritional Profile of 21 to 70 years Situational Analysis of Diet and Nutritional Profile of 21 to 70 years Urban Population with mpact Dr. Bhavana Chauhan S.M.Patel College Of HomeScience, S.M.Patel College Of HomeScience, Vallabh Vidyanagar Vallabh Vidyanagar, Gujarat, India calcium requirement. The result showed that the major source of calcium in diet was Milk & Milk Products with 90% consumption of milk and low consumption of Milk products among the subjects. Thus this study concluded that the result has revealed the sedentary life style and lo affect Bone Mineral Density. Keywords: Body Mass Index, Bone mineral Density, Diet, Calcium Intake Introduction Ageing is the accumulation of changes in a person over time. Ageing in multidimensional process of and social change. Some dimensions of ageing grow and expand over time, while others decline. Middle aged adults often show visible signs of as loss of skin elasticity hair. Physical fitness usually wa accumulation of body fat, reduction in aerobic performance and a decrease in maximal heart rate. Strength and flexibility also decrease throughout middle age. However, people age at different rates and there can be significant differenc individuals of the same age (Shephard R.J. 1998). Under nutrition is common in older people and has serious adverse effects. Weight loss and low body weight are key markers.(Chapman I.M., 2006) about age 35, people reach their peak bone mass. (Scharader et al, 2005, Thomson L., 2005, Ali and Siktber, 2001) Women lose bone mass slowly after Women lose bone mass slowly after ABSTRACT The study was planned to determine Bone health in urban population-middle-aged and older people, to assess nutrition knowledge, attitude and behaviour of urban population in relation to bone health, to conduct a BMD test to find the excess of demineralization and to investigate the nutrient intake of urban population in relation to their calcium status by Food frequency and 24 hour Diet Recall method. Total 70 subjects (32 male and 38 female) were randomly selected from hospital of urban Ahmedabad city that were in between of 21 to 70 years age group. results revealed that aanthropometric measurements showed that majority of the subjects had BMI 25 indicating overweight. The bone mineral density test showed de-mineralization in about 77% of the subjects.100% of the subjects were leading sedentary life which may be the cause of low bone mineral density. The maximum number of subjects (31%, N=22) who showed de- mineralization were found in the age group 31-40 years. The food frequency result showed poor consumption of green leafy vegetables (100% of subjects showed non-frequent consumption of green leafy vegetables) and poor consumption of fruits (100% of the subjects showed non consumption of Vitamin A Rich and Vitamin C Rich Fruits and only 64% showed frequent consumption of Calcium Rich Fruits).The result showed that the mean energy and protein intake of subjects was found to be low as compared to RDA.As per ICMR calcium requirement about 151% was met in case of male subjects and 136% fulfilment in case of female subjects but 60%-90% RDA could be met in case of adults and elderly subjects when looked into WHO adults and elderly subjects when looked into WHO The result showed that the o determine Bone health in aged and older people, to major source of calcium in diet was Milk & Milk Products with 90% consumption of milk and low consumption of Milk products among the subjects. Thus this study concluded that the result has revealed sedentary life style and low calcium intake may assess nutrition knowledge, attitude and behaviour of in relation to bone health, to conduct a BMD test to find the excess of demineralization and to investigate the nutrient intake of urban population in relation to their calcium status by Food frequency and 24 hour Diet Recall method. Total 70 subjects (32 male and 38 female) were randomly selected from hospital of urban Ahmedabad city that were in of 21 to 70 years age group. The study anthropometric measurements showed that majority of the subjects had BMI 25-29.9 overweight. The bone mineral density test mineralization in about 77% of the subjects.100% of the subjects were leading sedentary life which may be the cause of low bone mineral The maximum number of subjects (31%, mineralization were found in 40 years. The food frequency result showed poor consumption of green leafy vegetables Body Mass Index, Bone mineral Density, is the accumulation of changes in a person Ageing in multidimensional process of physical, psychological, and social change. Some dimensions of ageing grow and expand over time, while others decline. Middle- aged adults often show visible signs of aging such loss of skin elasticity and graying usually wanes, with a 5–10 kg accumulation of body fat, reduction in aerobic performance and a decrease in maximal heart humans humans refers refers to to a a of the frequent consumption of green leafy vegetables) and poor consumption of bjects showed non-frequent consumption of Vitamin A Rich and Vitamin C Rich Fruits and only 64% showed frequent consumption of Calcium Rich Fruits).The result showed that the mean energy and protein intake of subjects was found to be A.As per ICMR calcium requirement about 151% was met in case of male subjects and 136% fulfilment in case of female 90% RDA could be met in case of also decrease throughout middle age. However, people age at different rates and there can be significant differences between individuals of the same age (Shephard R.J. 1998). Under nutrition is common in older people and has serious adverse effects. Weight loss and low body weight are key markers.(Chapman I.M., 2006) By about age 35, people reach their peak bone mass. Scharader et al, 2005, Thomson L., 2005, Ali and @ IJTSRD | Available Online @ www.ijtsrd.com @ IJTSRD | Available Online @ www.ijtsrd.com | Volume – 1 | Issue – 5 Page: 188
International Journal of Trend in Scientific Research and Development (IJTSRD) ISSN: 2456-6470 that point until a few years after menopause, when bone mass is lost very rapidly. (Anderson et al., 2005, Keramet et al., 2001) For middle–aged and older women, healthy bones depend on the development, during younger years, of a strong bone structure and an adequate peak bone mass. Increasing urbanization and changes in diet and life style, in particular the “nutrition transition” away from fruit, vegetables and greater consumption of more ‘energy-dense, nutrient poor’ diets, dependence on television for leisure along with reduced levels of physical activity lead to obesity. (Malhotra and Mithal, 2007) Calcium is required for normal growth and development of the skeleton (Institute of Medicine, 1997) Adequate calcium intake is critical to achieving optimal peak bone mass and modifies the rate of bone loss associated with aging (National Institutes of Health, 1994). Over the past decade, convincing evidence has emerged with respect to effects of dietary calcium on bone health in all age groups (European Commission. Report, 1998). The role of calcium in bone health has been extensively reviewed elsewhere (Shea et al., 2004). Unfortunately, there are a significant proportion of some population groups failing to achieve the recommended calcium intakes in a number of Western countries (Cashman K.D., 2002) Materials and Methods To assess the nutritional status of urban population in Ahmedabad. The hospital was selected purposively; all subjects were aged between 21 to 70 years. Data of 70 subjects were taken and divided into two groups of male and female. Socio-demographic Profile (Semi structured questionnaire), Measurements like weight, height, bone density (Bone Mineral Density Test) using Ultrasound Bone Densitometer. and dietary intake using Food Frequency Questionnaire include all seven food groups (24hrs recall method) use collected from selected subjects. (n=70) Results and Discussion Socio demographic profile of the subjects (N=70) was obtained using a pre-tested questionnaire. The mean age of the subjects was found to be 44.63 ± 12.90. The assessment includes information on age, religion, food habit, family composition, family income & economic status. Very large group of subjects i.e. 93% were from Hindu community. Majority of the subjects were vegetarian. Only 6.25% i.e. 2 subjects among the males and 10.53% i.e. 4 subjects among the females were non-vegetarian and 100% of the subjects were observed to have a sedentary life style. Anthropometric Table 1: Age wise distribution of selected subject AGE GROUP 21-30 31-40 41-50 51-60 61-70 TOTAL 15.78% 28.95% 28.95% 13.16% 13.16% 100% Females 12.50% 31.25% 21.87% 18.75% 15.63% 100% Males Figure 1: Distribution of male and female subjects showing height with reference to mean height MALES FEMALES 100.00% 53.13% 55.00% 60.53% 50.00% 46.87% 39.47% 50.00% 45.00% 40.00% 0.00% Height>166.56 cms Height<166.56 cms Height>157.20cms Height<157.20cms @ IJTSRD | Available Online @ www.ijtsrd.com | Volume – 1 | Issue – 5 Page: 189
International Journal of Trend in Scientific Research and Development (IJTSRD) ISSN: 2456-6470 The result showed that about 46.87% (N=15) of the males were falling above the mean height. 53.13% (N=17) of the males fall below the mean height while about 39.47% (N=15) of the females were falling above the mean height. 60.53% (N=23) of the females fall below the mean height. Figure 2: Distribution of male and female subjects showing weight with reference to mean weight 84.37% 100.00% Males 86.84% 100.00% Females 50.00% 50.00% 13.16% 15.63% 0.00% 0.00% Weight>55 Kgs Weight<55 Kgs Weight>60 Kgs Weight<60 Kgs The result showed that about 84.37% (N=27) of the males were above the standard weight. 15.63% (N=5) of the males fall below the standard weight whereas about 86.84% (N=33) of the females were falling above the reference weight. 13.16% (N=5) of the females fall below the reference weight. 46.87% of the males had BMI less than mean BMI whereas 53.13% of the males had BMI greater than mean and for female 52.63% of the females had BMI less than mean BMI whereas 47.37% of the females had BMI greater than mean BMI. Table 2: Percentage of male and female subjects T score during BMD test According to the results majority of the subjects were found Osteoporotic irrespective of the gender. Subjects with Osteopenia were more among females (73.68%, N=28) as compared to males (68.75%, N=22). One subject among males and three subjects among females were found Osteoporotic. Table 3: Percentage of Male Subjects showing disorders with BMI NORMAL < -1 Between -1 & -2.5 <18.5 0% 6.25% 0% 12.5% BMD CONDITION % of Males % of Females 28.12% 18.42% -1 and above Normal 68.75% 73.68% Between -1 & -2.5 Osteopenia 3.13% 7.9% -2.5 or lower Osteoporosis OSTEOPENIA OSTEOPOROSIS > -2.5 or lower 0% BMI RANGE TOTAL 6.25% 0% 18.5 - 24.9 12.5% 21.87% 34.37% 3.14% 25 - 29.9 59.38% 6.25% 15.62% 0% >30 21.87% TOTAL 28.12% 68.74% 3.14% 100% Majority of the male Subjects were found Osteoporotic among male subjects. It can be depicted from the table that as the BMI increases percentage of the subjects with Osteopenia increases. 59.38% (N=19) of the male subjects were found Osteopenic. One of the subject among males showed Osteoporosis score as per BMI. @ IJTSRD | Available Online @ www.ijtsrd.com | Volume – 1 | Issue – 5 Page: 190
International Journal of Trend in Scientific Research and Development (IJTSRD) ISSN: 2456-6470 Table 4: Percentage of the Female Subjects showing Bone Disorders with BMI BMI RANGE NORMAL > -1 OSTEOPENIA Between -1 & -2.5 OSTEOPOROSIS < -2.5 or lower TOTAL 0% 0% 0% <18.5 0% 7.90% 15.79% 0% 18.5 - 24.9 23.69% 7.90% 42.10% 0% 25 - 29.9 50% 2.62% 15.79% 7.90% > 30 26.31% TOTAL 18.42% 73.68% 7.90% 100% Majority of the Subjects were found suffering from Osteopenia among females i.e.73.68% (N=28). Three of the subjects among females showed Osteoporosis score as per BMD score falling under obese category of BMI (>30). The food frequency result showed poor consumption of green leafy vegetables (100% of subjects showed non-frequent consumption of green leafy vegetables) and poor consumption of fruits (100% of the subjects showed non-frequent consumption of Vitamin A Rich and Vitamin C Rich Fruits and only 64% showed frequent consumption of Calcium Rich Fruits). This indicates faulty lifestyle which may not be good for health. Might be low income or gender difference of being a girl or a mother dominates for not getting proper nutrition in some families. The result showed that the mean energy and protein intake of subjects was found to be low as compared to RDA. As per ICMR calcium requirement about 151% was met in case of male subjects and 136% fulfillment in case of female subjects but 60%-90% RDA could be met in case of adults and elderly subjects when looked into WHO calcium requirement. Calcium: Phosphorus ratio was found to be 1.05:1 which is appropriate as per ICMR Ca:P Ratio (1:1). The result showed that the major source of calcium in diet was Milk & Milk Products with 90% consumption of milk and low consumption of milk products among the subjects. Conclusion Thestudy concluded that the sedentary life style and low calcium intake may affect Bone Mineral Density.It is recommended that a detailed dietary survey should be conducted regarding calcium and Phosphorus intake to identify the causative factors for the de-mineralization of bones. Health education should be given to individuals regarding the future aspects of healthy diet and healthy physical activities. REFERENCES 1)Ali N. &Siktberg L. (2001). Osteoporosis prevention in female adolescents: calcium intake and exercise participation. Paediatric Nursing, 27 (2), 132-139. 2)Anderson K., Chad K. & Spink K. (2005). Osteoporosis knowledge, beliefs and practices among females, 36, 305-312. 3)Cashman K. D. (2002) Calcium intake, calcium bioavailability and bone health. Br Nutr, a.87:,169–77. 4)Chapman I.M. (2006) Nutritional disorders in the elderly. 5)European Commission. osteoporosis in the European Community: action for prevention. Luxembourg: Office for Official Publications for the European Commission. 6)Institute of Medicine (1997) Dietary reference intakes: calcium, magnesium, phosphorus, vitamin D, and fluoride. Washington, DC: National Academy Press. 7)Keramet A, Bhambhari R, Chakravaty D, Mithal A. (2003) Spinal bone mineral density in healthy urban Asian Indian women presenting for a preventive health check-up. J Bone Miner Res., 18 (1) 8)Malhotra N. and Mithal N. (2007) Report (1998) on @ IJTSRD | Available Online @ www.ijtsrd.com | Volume – 1 | Issue – 5 Page: 191
International Journal of Trend in Scientific Research and Development (IJTSRD) ISSN: 2456-6470 9)National Institutes of Health (1994) Optimal calcium intake. NIHConsensus Statement. 12:4. 10)Scharader,S., Blue,R. &Horner,A. (2005). Better Bone Buddies: an osteoporosis prevention program. The Journal of School Nursing.21(5): 105-114. 11)Shea B, Wells G, Cranney A, Zytaruk N, Robinson V, Griffith L, Hamel C, Ortiz Z, Peterson J, (2004) Calcium supplementation on bone loss in postmenopausal women. Cochrane Database Syst Rev, 1. 12)Shephard R. J. Exercise". Encyclopedia of Sports Medicine and Science (T.D.Fahey). 13)Thomas,L. (2005).Osteoporosis. The Gamma Series of the Royal Society of New Zealand.1-4. (1998). "Aging and @ IJTSRD | Available Online @ www.ijtsrd.com | Volume – 1 | Issue – 5 Page: 192