Download
1 / 6
60 likes | 66 Views
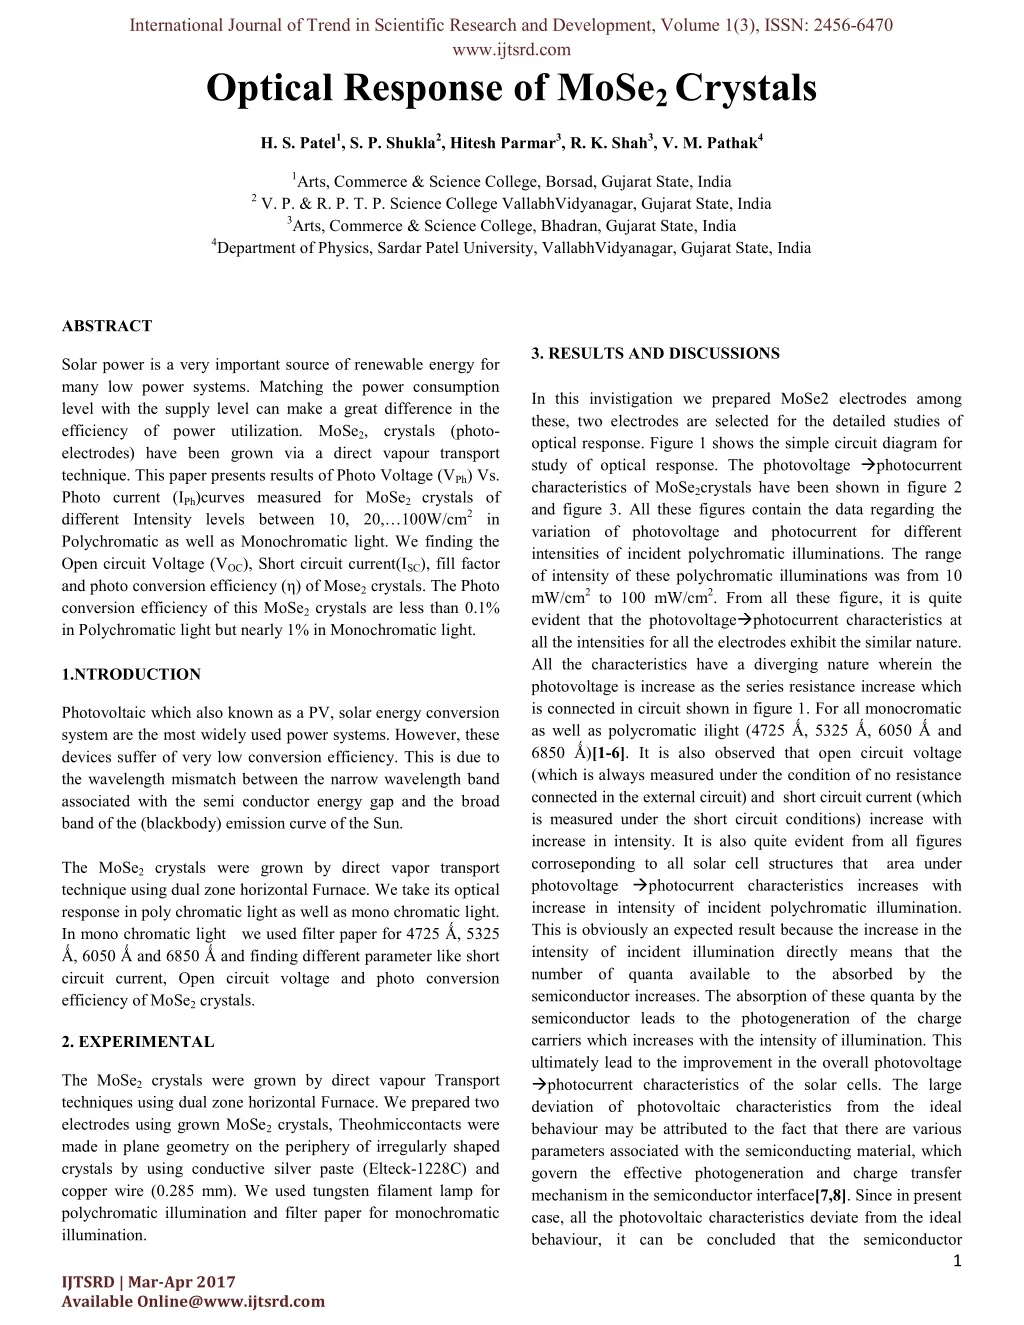
Solar power is a very important source of renewable energy for many low power systems. Matching the power consumption level with the supply level can make a great difference in the efficiency of power utilization. MoSe2, crystals (photo-electrodes) have been grown via a direct vapour transport technique. This paper presents results of Photo Voltage (VPh) Vs. Photo current (IPh)curves measured for MoSe2 crystals of different Intensity levels between 10, 20,'u00a6100W/cm2 in Polychromatic as well as Monochromatic light. We finding the Open circuit Voltage (VOC), Short circuit current(ISC), fill factor and photo conversion efficiency (?) of Mose2 crystals. The Photo conversion efficiency of this MoSe2 crystals are less than 0.1% in Polychromatic light but nearly 1% in Monochromatic light H. S. Patel | S. P. Shukla | Hitesh Parmar"Optical Response of MoSe2 Crystals" Published in International Journal of Trend in Scientific Research and Development (ijtsrd), ISSN: 2456-6470, Volume-1 | Issue-3 , April 2017, URL: http://www.ijtsrd.com/papers/ijtsrd66.pdf http://www.ijtsrd.com/other-scientific-research-area/physics/66/optical-response-of-mose2-crystals/h-s-patel<br>

E N D
International Journal of Trend in Scientific Research and Development, Volume 1(3), ISSN: 2456-6470 www.ijtsrd.com Optical Response of MoSe2 Crystals H. S. Patel1, S. P. Shukla2, Hitesh Parmar3, R. K. Shah3, V. M. Pathak4 1Arts, Commerce & Science College, Borsad, Gujarat State, India 2 V. P. & R. P. T. P. Science College VallabhVidyanagar, Gujarat State, India 3Arts, Commerce & Science College, Bhadran, Gujarat State, India 4Department of Physics, Sardar Patel University, VallabhVidyanagar, Gujarat State, India ABSTRACT 3. RESULTS AND DISCUSSIONS Solar power is a very important source of renewable energy for many low power systems. Matching the power consumption level with the supply level can make a great difference in the efficiency of power utilization. MoSe2, crystals (photo- electrodes) have been grown via a direct vapour transport technique. This paper presents results of Photo Voltage (VPh) Vs. Photo current (IPh)curves measured for MoSe2 crystals of different Intensity levels between 10, 20,…100W/cm2 in Polychromatic as well as Monochromatic light. We finding the Open circuit Voltage (VOC), Short circuit current(ISC), fill factor and photo conversion efficiency (η) of Mose2 crystals. The Photo conversion efficiency of this MoSe2 crystals are less than 0.1% in Polychromatic light but nearly 1% in Monochromatic light. 1.NTRODUCTION Photovoltaic which also known as a PV, solar energy conversion system are the most widely used power systems. However, these devices suffer of very low conversion efficiency. This is due to the wavelength mismatch between the narrow wavelength band associated with the semi conductor energy gap and the broad band of the (blackbody) emission curve of the Sun. The MoSe2 crystals were grown by direct vapor transport technique using dual zone horizontal Furnace. We take its optical response in poly chromatic light as well as mono chromatic light. In mono chromatic light we used filter paper for 4725 Ǻ, 5325 Ǻ, 6050 Ǻ and 6850 Ǻ and finding different parameter like short circuit current, Open circuit voltage and photo conversion efficiency of MoSe2 crystals. 2. EXPERIMENTAL The MoSe2 crystals were grown by direct vapour Transport techniques using dual zone horizontal Furnace. We prepared two electrodes using grown MoSe2 crystals, Theohmiccontacts were made in plane geometry on the periphery of irregularly shaped crystals by using conductive silver paste (Elteck-1228C) and copper wire (0.285 mm). We used tungsten filament lamp for polychromatic illumination and filter paper for monochromatic illumination. In this invistigation we prepared MoSe2 electrodes among these, two electrodes are selected for the detailed studies of optical response. Figure 1 shows the simple circuit diagram for study of optical response. The photovoltage photocurrent characteristics of MoSe2crystals have been shown in figure 2 and figure 3. All these figures contain the data regarding the variation of photovoltage and photocurrent for different intensities of incident polychromatic illuminations. The range of intensity of these polychromatic illuminations was from 10 mW/cm2 to 100 mW/cm2. From all these figure, it is quite evident that the photovoltagephotocurrent characteristics at all the intensities for all the electrodes exhibit the similar nature. All the characteristics have a diverging nature wherein the photovoltage is increase as the series resistance increase which is connected in circuit shown in figure 1. For all monocromatic as well as polycromatic ilight (4725 Ǻ, 5325 Ǻ, 6050 Ǻ and 6850 Ǻ)[1-6]. It is also observed that open circuit voltage (which is always measured under the condition of no resistance connected in the external circuit) and short circuit current (which is measured under the short circuit conditions) increase with increase in intensity. It is also quite evident from all figures corroseponding to all solar cell structures that area under photovoltage photocurrent characteristics increases with increase in intensity of incident polychromatic illumination. This is obviously an expected result because the increase in the intensity of incident illumination directly means that the number of quanta available to the absorbed by the semiconductor increases. The absorption of these quanta by the semiconductor leads to the photogeneration of the charge carriers which increases with the intensity of illumination. This ultimately lead to the improvement in the overall photovoltage photocurrent characteristics of the solar cells. The large deviation of photovoltaic characteristics from the ideal behaviour may be attributed to the fact that there are various parameters associated with the semiconducting material, which govern the effective photogeneration and charge transfer mechanism in the semiconductor interface[7,8]. Since in present case, all the photovoltaic characteristics deviate from the ideal behaviour, it can be concluded that the semiconductor 1 IJTSRD | Mar-Apr 2017 Available Online@www.ijtsrd.com
International Journal of Trend in Scientific Research and Development, Volume 1( International Journal of Trend in Scientific Research and Development, Volume 1(3), ISSN: www.ijtsrd.com icoducting materials have a large contribution to mar the photovoltaic behaviour. It is also possible that the bend bending which is required for better ), ISSN: 2456-6470 parameters of the semicoducting materials have a large contribution to mar the photovoltaic behaviour. It is also possible that the bend bending which is required for better quality. But the photovoltaic characteristics observed in all the quality. But the photovoltaic characteristics observed in all the cases confirm the cases confirm the following following facts[9]. facts[9]. hv MoSe2 Crystal mV µA Rh Figure 1. Simple circuit diagram of MoSe Figure 1. Simple circuit diagram of MoSe2 crystal Optical Response. crystal Optical Response. 12 10 10 mW/cm2 30 mW/cm2 50 mW/cm2 70 mW/cm2 90 mW/cm2 90 mW/cm2 10 mW/cm2 30 mW/cm2 50 mW/cm2 70 mW/cm2 20 mW/cm2 40 mW/cm2 60 mW/cm2 80 mW/cm2 100 mW/cm2 10 Photo Current IPh(µA) Photo Current IPh(µA) 8 8 6 6 4 4 2 2 0 0 0 0.5 1 1.5 2 2 (mV) 2.5 3 0 0.5 1 1.5 2 2.5 3 Photo Voltage (VPh) mV ) mV Photovoltage VPh (mV) Figure: 2. Vph Iph characteristics of MoSe2crystalat different intensities crystalat different intensities of illuminations (Polychromatic light) for sample 1. of illuminations (Polychromatic light) for sample 1. 2 IJTSRD | Mar-Apr 2017 Available Online@www.ijtsrd.com
International Journal of Trend in Scientific Research and Development, Volume 1(3), ISSN: 2456-6470 www.ijtsrd.com 4 5 3.5 20 mW/cm2 40 mW/cm2 60 mW/cm2 80 mW/cm2 100 mW/cm2 4.5 Photo Current IPh(µA) 10 mW/cm2 30 mW/cm2 50 mW/cm2 70 mW/cm2 90 mW/cm2 Photo Current IPh (µA) 3 4 3.5 2.5 3 2 2.5 1.5 2 1 1.5 1 0.5 0.5 0 0 0 1 2 3 4 5 0 1 2 3 4 5 Photo Voltage VPh (mV) Photo Voltage VPh(mV) We take optical response of MoSe2 crystals and estimate the below parameters,[10] 1.Short circuit current 2.Open circuit voltage 3.Fill factor 4.Incident Photoconversion efficiency 3.1. Short circuit current (Isc) 3.2. Open circuit voltage (Voc) Figure: 3. Vph Iph characteristics of MoSe2crystalat different intensities of illuminations (Polychromatic light)for sample2. Ideally, this is equal to the light generated current IL. The current measured directly across the electrode in the absence of any load (without load) in the external circuit is referred to as the short circuit current. It is given as, The voltage measured in plane of the MoSe2 crystals when there is infinite load (i.e. open circuit) in the circuit is termed as the open circuit voltage. It can be written as, nkT e eV kT Voc = ln (IL) (2) oc I I 0exp 1 sc (1) where n = ideality factor kT/e = 0.0259 volt (at =300K) IL = Intensity of illumination This parameter depends on the band gap of the semiconductor .Smaller the band gap greater is the expected short circuit current. Thus, the open circuit voltage is expected to increase with the increase in the incident illumination intensity and bothsamples have same behavior.In comparison of open circuit voltage and short circuit current for monochromatic is higher than open circuit voltage and short circuit current for polychromatic illumination. 3 IJTSRD | Mar-Apr 2017 Available Online@www.ijtsrd.com
International Journal of Trend in Scientific Research and Development, Volume 1( International Journal of Trend in Scientific Research and Development, Volume 1(3), ISSN: www.ijtsrd.com 12 ), ISSN: 2456-6470 3.5 3.5 12 Voc Isc Voc Isc 3 3 10 10 2.5 2.5 8 8 Voc (mV) Voc (mV) 2 2 6 6 1.5 1.5 Isc (µA) Isc (µA) 4 4 1 1 2 0.5 2 0.5 0 0 0 0 0 10 20 30 40 50 60 70 80 90100110 0 10 20 30 40 50 60 70 80 90 100 100110 (mW/cm2) Intensity IL(mW/cm Intensity IL(mW/cm2) Sample : 2 Sample : 2 Sample : 1 Figure: 4. Voc, Isc IL characteristics of MoSe characteristics of MoSe2crystalsat different intensities of illuminations (Polychromatic) for sample1 and 2. crystalsat different intensities of illuminations (Polychromatic) for 18 5 4725Å 5325Å 6050Å 6850Å 4725Å 4.5 16 5325Å 4 14 Voc (mV) 6050Å 3.5 Isc (A) 12 3 6850Å 10 2.5 8 2 6 1.5 4 1 0.5 2 0 0 0 10 20 30 40 50 60 70 80 80 90 100 0 10 20 30 40 50 Intensity (mW/cm Intensity (mW/cm2) 60 70 80 90 100 Intensity (mW/cm2) ) Figure: 5. Voc IL andIsc ILcharacteristics of MoSe characteristics of MoSe2crystalsat different intensities of illuminations (Monochromatic) for sample1. Sample : 2 2 crystalsat different intensities of illuminations 7 14 4725Å 5325Å 6050Å 6850Å 4725Å 5325Å 6050Å 6850Å 6 12 5 10 Voc (mV) 4 isc (A) 8 3 6 2 4 1 2 0 0 0 10 20 30 40 50 60 70 80 Intensity (mW/cm2) 80 90 100 0 10 20 30 40 50 60 70 80 90 100 Intensity (mW/cm Intensity (mW/cm2) Figure: 6. Voc IL andIsc ILcharacteristics of MoSe characteristics of MoSe2crystalsat different intensities of (Monochromatic) for sample2. crystalsat different intensities of illuminations 4 IJTSRD | Mar-Apr 2017 Available Online@www.ijtsrd.com
International Journal of Trend in Scientific Research and Development, Volume 1( International Journal of Trend in Scientific Research and Development, Volume 1(3), ISSN: www.ijtsrd.com ), ISSN: 2456-6470 3.3Fill factor We characteristics of MoSe2crystals at polychromatic light and calculated some parameters of term used to departure is known as the fill factor (F.F.) defined as, departure is known as the fill factor (F.F.) defined as, drowthe photovoltage (Vph) – photocurrent photocurrent (I (Iph) 0.09 0.4 Photoconversion Efficiency Fill Factor Photoconversion Efficiency Photoconversion Efficiency (η) % crystals at polychromatic light and 0.08 0.35 calculated some parameters of term used to express this 0.07 0.3 0.06 0.25 Fill Factor 0.05 Jmp Vmp Jsc Voc * * 0.2 Fill Factor = (3) 0.04 0.15 0.03 0.1 0.02 Isc m I Area p whereJmp = and Jsc = 0.05 0.01 Area 0.00 0 whereJmp = the current density at maximum power point whereJmp = the current density at maximum power point 0 10 20 30 40 50 60 70 80 90100 Vmp = the voltage at maximum power point ` Imp= the short circuit current at maximum power point Jsc= short circuit current density Voc =open circuit voltage (mW/cm2) IntensityIL(mW/cm = the short circuit current at maximum power point Sample : 1 Sample : 1 Photoconversion Efficiency Fill factor Photoconversion Efficiency 0.04 0.35 Photoconversion Efficiency (%) 0.035 3.4PhotoconversionEfficiency (ŋ) 0.3 0.03 0.25 Fill factor The photoconversion efficiency of solar cells is given by the relation, solar cells is given by the 0.025 0.2 0.02 = * mp mp V J I = 0.15 0.015 0.1 (4) 0.01 L 0.005 0.05 IL = the intensity of incident illumination. 0 10 20 30 40 50 60 Intensity IL(mW/cm 70 80 90 100 (mW/cm2) Sample : 2 Sample : 2 The photoconversion efficiency and a fill factor were calculated for all solar cell structures under investigations for all the intensities of incident illuminations. The variation of the photoconversion efficiency and fill factor with the incident illumination intensity for all the solar cell structures has been shown in figures7. From figure 7, we can conclude that as the intensity increase Fill factor and photoconversion efficiency is decrease and increase respectively. photoconversion efficiencies were found to be less than 0.1% which is significantly low. So, it can be said that the solar cell structure fabricated in present investigations have so many factors governing the overall photoconversion mechanism 17]. The photoconversion efficiency and a fill factor were calculated for all solar cell structures under investigations for all the intensities of incident illuminations. The variation of the photoconversion efficiency and fill factor with the incident ation intensity for all the solar cell structures has been shown in figures7. From figure 7, we can conclude that as the intensity increase Fill factor and photoconversion efficiency is decrease and increase respectively. ciencies were found to be less than 0.1% which is significantly low. So, it can be said that the solar cell structure fabricated in present investigations have so many factors governing the overall photoconversion mechanism [10- Figure 7. Variation of photoconversion efficiency (η) and fill factor with intensity of illuminations (polychromatic light) Figure 7. Variation of photoconversion efficiency (η) and fill factor with intensity of illuminations (polychromatic light) for Sample 1 and 2. We take also optical response of MoSe2 crystals of Monochromatic light at 4725 Å, 5325 Å, 6050 Å and 6850Å , and estimating the photoconversion efficiency for studying particular wavelength by using formula (Eq. 4).The values of photoconversion efficiencies were found to be nearly 1% which We take also optical response of MoSe Monochromatic light at 4725 Å, 5325 Å, 6050 Å and and estimating the photoconversion efficiency for studying particular wavelength by using formula (Eq. 4).The values of photoconversion efficiencies were found to be nearly 1% which is significantly low. The The values values of of 5 IJTSRD | Mar-Apr 2017 Available Online@www.ijtsrd.com
International Journal of Trend in Scientific Research and Development, Volume 1( International Journal of Trend in Scientific Research and Development, Volume 1(3), ISSN: www.ijtsrd.com ), ISSN: 2456-6470 1.4 0.9 4725Å 5325Å 6050Å 6850Å 4725Å 5325Å 6050Å 6850Å Photoconversion Efficiency (%) Photoconversion Efficiency (η)% 0.8 1.2 0.7 1 0.6 0.8 0.5 0.4 0.6 0.3 0.4 0.2 0.2 0.1 0 0 0 10 20 30 40 50 60 70 80 90 Intensity IL(mW/cm2) 90 100 0 10 20 30 40 50 Intensity IL(mW/cm 50 60 70 80 90 100 (mW/cm2) Sample : 1 Sample : 2 Sample : 2 Figure 8.Variation of photoconversion efficiency (η) with intensity of illuminations (Monochromatic light) for Sample 1 and 2. light) for Sample 1 and 2. photoconversion efficiency (η) with intensity of illuminations (Monochromatic photoconversion efficiency (η) with intensity of illuminations (Monochromatic 5. REFERENCES 4. CONCLUSION 1)B Bhattacharya, S. K. Tomar and Jung Nanotechnology,18(2007) 48571. 2)M. S. Kang et. al., Chem. Commun 3)Fei Cao, Gerkooskam and Peter C. Searson, Chem., 99 (1995) 17071. 4)A F Nogueria Solar energy Materials & Solar Cells, (2000) 135. 5)C Fang, Qianfeixu Applied Physics Letters 6951 84 (2004) 31813. 6)C. D. Lokhande and Pawar S. H., Mater., 7 (1982) 313. 7)J. F. McCann, M Kazacos and D Haneman, (1981) 780. 8)Lynn F. Schneemeyer and Mark S. WrightonSchnemeyer, Appl. Phys. Lett 9)V. M. Pathak & R. Srivastava letters,12, No, 11 (1989). 10) martin A. Green, Solar cells operating principles, technology and system applications, Nick Holonyak, Jr., Editor 11)Fei Cao, GerkoOskam, and Peter C. Searson, J Chem. (1995), 99 17071. 12)B. Bhattacharya, S. K. Tomar and Jung Nanotechnology, 18(2007) 48571. 13)Marco A. De Paoli, A F. Nogueria Materials & Solar Cells,61 14)M. M. Salleh, M.Y.A Rahman Ahemed,.J. Current Appl.Phys 15)N. Mullen and D. Cahen, Solar cells 16)M SkyallusKazacos., F.F.McCann and D. Haneman, Solar Energy Mater., 4 (1981) 215. B Bhattacharya, S. K. Tomar and Jung – Ki Park (2007) 48571. Chem. Commun., (2005) 889. Fei Cao, Gerkooskam and Peter C. Searson, J. Phys. A photovoltaic cell consists of light absorbing material which is connected with external circuits in asymmetric manner. Charge carriers are generated in the material by the absorption of photon of light, and are driven towards one or other of the contact by the built in spatial asymmetry. When a load connected to external circuit, the cell produce current and voltage and can to electric work this light driven charge separation established photovoltage at open circuit & generated a photocurrent at short circuit. We are finding the photo conversion efficiency of MoSe crystals in polychromatic light nearly 0.1% and monochromatic light nearly 1%. A photovoltaic cell consists of light absorbing material which is in asymmetric manner. Charge carriers are generated in the material by the absorption of photon of light, and are driven towards one or other of the contact by the hen a load connected to external rent and voltage and can to electric en charge separation established a generated a photocurrent at short Solar energy Materials & Solar Cells,61 Applied Physics Letters, ISSN 0003- C. D. Lokhande and Pawar S. H., Solar Energy We are finding the photo conversion efficiency of MoSe2 crystals in polychromatic light nearly 0.1% and monochromatic J. F. McCann, M Kazacos and D Haneman, Nature,289 Lynn F. Schneemeyer and Mark S. Appl. Phys. Lett., R. Srivastava, Nat. Acad. Sci. martin A. Green, Solar cells operating principles, technology and system applications, Nick Holonyak, Fei Cao, GerkoOskam, and Peter C. Searson, J. Phys. B. Bhattacharya, S. K. Tomar and Jung – Ki Park, (2007) 48571. A F. Nogueria Solar energy 61(2000)135 M.Y.A Rahman, I. A.Talib & A. J. Current Appl.Phys, 7 Issues 4, (2007), 446. Solar cells9 (1983), 229. SkyallusKazacos., F.F.McCann and D. Haneman, 6 IJTSRD | Mar-Apr 2017 Available Online@www.ijtsrd.com