Download
1 / 6
60 likes | 63 Views
Social network analysis SNA is the technique of performing analytics on data found in social environmental circles to understand the relationships and structures of underlying network. With the alarming rise of social media, many different concepts have been brought about through the behavior of people within these network. Of great confusion was how to identify and award credits to members who greatly influence the social network. This paper seeks to bring out the various networks in a social setting. It is known there can be a number of networks that can be drawn from the same dataset, the key objective thereforeis to help in the evaluation of academicfaculty membersin tertiary institutions and prove that those who fill the empty space i.e. structural hole in the network perform better.For a while it has been known that academic networks analysis has been largely implemented based on citation graphs not other attributes like areas of interest, interdisciplinary work and . The major drawback with this kind of analysis is that, the efficiency and homophily strong ties that exist between the faculty members outside of their citations could not be uncovered. While some members have low number of citations it however does not imply they are least hard working. Some members perform better in conference presentations while lagging in citations, therefore by imploring the citation graph it entails that these members could not be fully representedby theireffort and contribution to the society. With this proposed model the underlying ties between faculty members is based on their areas of interestwhich has been an untamed domain. This will be analyzed against Butts' structural hole theory and see if it applies to academic institutions. Key questions to be answered are how these areas of interest have influenced fellow colleagues within their network and how it has earned them, if any, advantageous posts in institutions that have various members with different interests in one department. In an extended study the leadership strength of members in structural hole can also be determined. Nyasha F. Thusabantu | Dr. G Vadivu | Mr. L. Thusabantu "Implementing the Structural Hole Theory to Analyze Academic Networks in Tertiary Institutions" Published in International Journal of Trend in Scientific Research and Development (ijtsrd), ISSN: 2456-6470, Volume-1 | Issue-5 , August 2017, URL: https://www.ijtsrd.com/papers/ijtsrd2361.pdf Paper URL: http://www.ijtsrd.com/computer-science/artificial-intelligence/2361/implementing-the-structural-hole-theory-to-analyze-academic-networks-in-tertiary-institutions/nyasha-f-thusabantu<br>

E N D
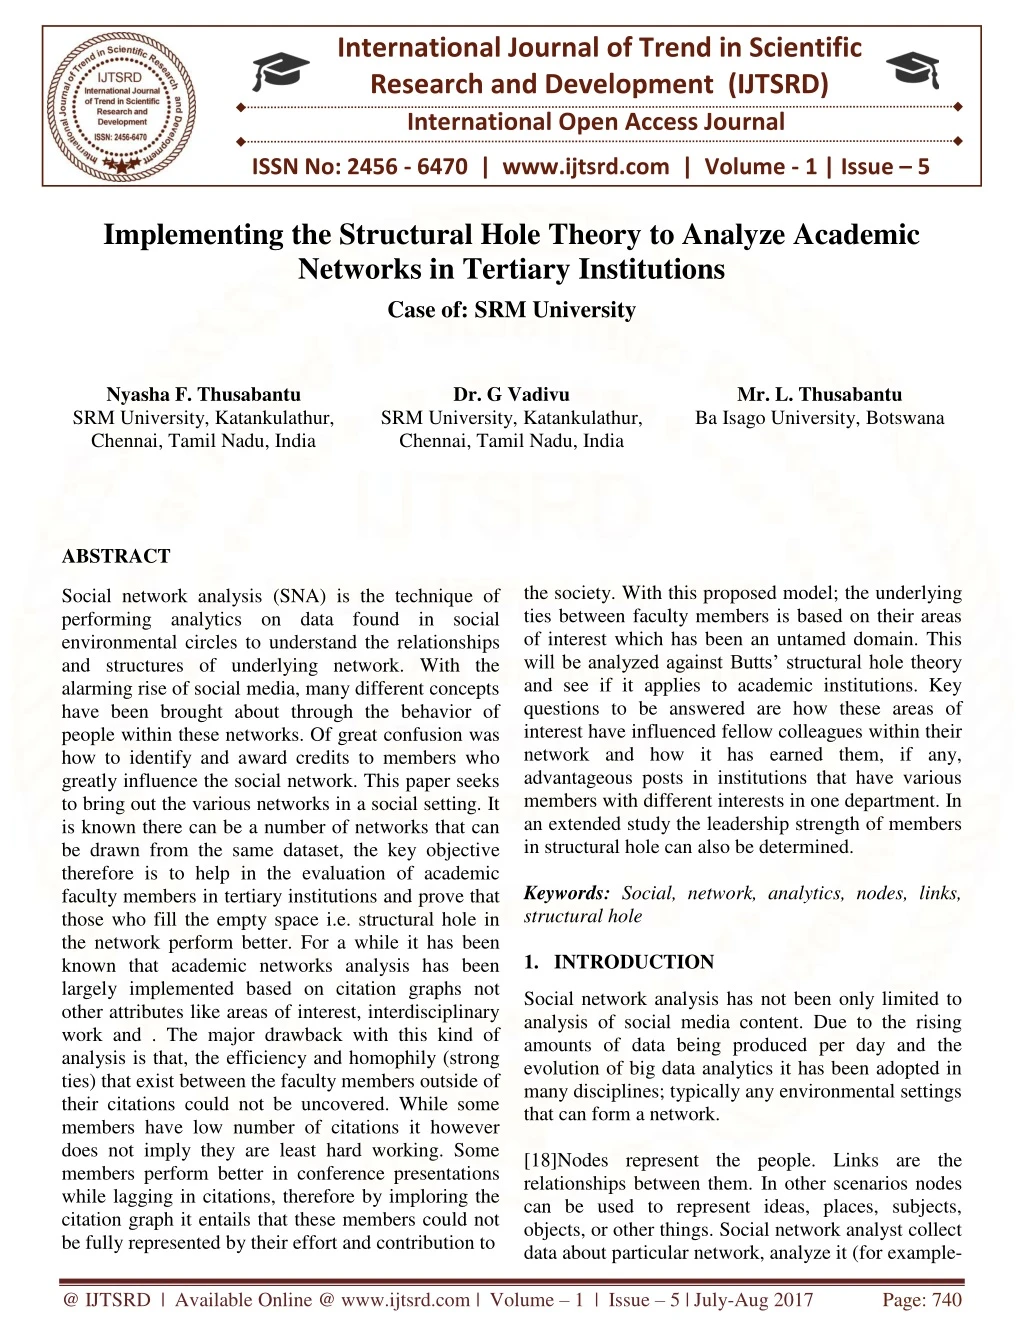
International Journal of Trend in Scientific Research and Development (IJTSRD) International Open Access Journal ISSN No: 2456 - 6470 | www.ijtsrd.com | Volume - 1 | Issue – 5 Implementing the Structural Hole Theory to Analyze Academic Networks in Tertiary Institutions Case of: SRM University Nyasha F. Thusabantu SRM University, Katankulathur, Chennai, Tamil Nadu, India Chennai, Tamil Nadu, India Dr. G Vadivu Mr. L. Thusabantu Ba Isago University, Botswana SRM University, Katankulathur, ABSTRACT the society. With this proposed model; the underlying ties between faculty members is based on their areas of interest which has been an untamed domain. This will be analyzed against Butts’ structural hole theory and see if it applies to academic institutions. Key questions to be answered are how these areas of interest have influenced fellow colleagues within their network and how it has earned them, if any, advantageous posts in institutions that have various members with different interests in one department. In an extended study the leadership strength of members in structural hole can also be determined. Keywords: Social, network, analytics, nodes, links, structural hole 1.INTRODUCTION Social network analysis (SNA) is the technique of performing analytics on data found in social environmental circles to understand the relationships and structures of underlying network. With the alarming rise of social media, many different concepts have been brought about through the behavior of people within these networks. Of great confusion was how to identify and award credits to members who greatly influence the social network. This paper seeks to bring out the various networks in a social setting. It is known there can be a number of networks that can be drawn from the same dataset, the key objective therefore is to help in the evaluation of academic faculty members in tertiary institutions and prove that those who fill the empty space i.e. structural hole in the network perform better. For a while it has been known that academic networks analysis has been largely implemented based on citation graphs not other attributes like areas of interest, interdisciplinary work and . The major drawback with this kind of analysis is that, the efficiency and homophily (strong ties) that exist between the faculty members outside of their citations could not be uncovered. While some members have low number of citations it however does not imply they are least hard working. Some members perform better in conference presentations while lagging in citations, therefore by imploring the citation graph it entails that these members could not be fully represented by their effort and contribution to Social network analysis has not been only limited to analysis of social media content. Due to the rising amounts of data being produced per day and the evolution of big data analytics it has been adopted in many disciplines; typically any environmental settings that can form a network. [18]Nodes represent the people. Links are the relationships between them. In other scenarios nodes can be used to represent ideas, places, subjects, objects, or other things. Social network analyst collect data about particular network, analyze it (for example- @ IJTSRD | Available Online @ www.ijtsrd.com | Volume – 1 | Issue – 5 | July-Aug 2017 Page: 740
International Journal of Trend in Scientific Research and Development (IJTSRD) ISSN: 2456-6470 e.g. with special purpose SNA software), and often produce visual representation of the patterns that can be observed. These visual displays can be maps or pictures. The analysis of social networks has gained a lot of attention in the research and development sector. This has not only been entirely based on the analysis of current trending online social media content (e.g. Twitter, Facebook) but largely in providing comprehensive understanding in the domain of scientific research. An academic network is seen as a network which integrates scientific factors, such as areas of interest, authors, papers, publishing journals, conferences attended and their relationships. With the rapid adoption of online digital libraries, the proliferation of large quantities of scientific literature creates a magnitude opportunity to extract the textual content of these scientific factors (that is-i.e., publishing papers) as well as their mutual relationships (citation, authorship),and therefore stimulates the emergence of many applications that are significantly and undeniably important in academic domain for the purpose of mining and analyzing academic networks, such as expert ranking, citation prediction, cited author prediction, venue prediction, etcetera-etc. 2.LITERATURE SURVEY: EXISTING SYSTEMS The particular existing systems have never analyzed the research interest of different entities found in the academic networks. Mostly they have structured the analysis of academic networks around citations, journal publications and conference presentations attended. The Author Topic Modelling is one of the major concepts that have been overly adopted in this kind of analysis. It makes use of the generative topic modelling which is a popular unsupervised learning technique for topic-related content representation. Initially, it was utilized in pure contextual analysis. Probabilistic Latent Semantic Analysis (PLSA) and Latent Dirichlet Allocation (LDA), are representative models of this kind that exploit co-occurrence patterns of words in documents and seek to unearth the semantic clusters (topics) of words. In these models each document would be attributed as a fusion over multiple latent topics. made based upon pairs of papers, which is quite different from the model we propose in this paper that particularly emphasizes the interests and influence of authors. Several representative works have been proposed to extend ATM. [7] The Author-Conference-Topic (ACT) model adds contextual information, the publishing venues of papers, to represent venues’ influence over topics. The Author-Conference-Topic- Connection model extends by introducing an additional latent variable ‘subject’, from which the conferences (venues) and topics can be respectively generated. The Citation-Author-Topic (CAT) model greatly considers the information of the author that was cited. This enables the elimination of any bias of authors’ influence over other any authors. 3.PROPOSED METHODOLOGY areas of interest co- [17]Rosen-Zvietalhas brought forward the idea to extend the PLSA and LDA to include modelling of authors’ interests. This would provide a way to simultaneously model the content of documents and their authors’ respective interests, such that the mixture weights for different topics would be determined by the authors of the documents. This project seeks to extend his idea so that the analysis of university academic networks structural hole can be improved by the inclusion of areas of interest. This adds clarity as to who is perform well in their area of interest and who they can be clustered with for effective utilization of passion and knowledge. The faculty members are vertices, the edges between faculty members represent academic area of interest.[18]This theory of structural holes was pioneered by Ron Burt[1, 4, 3]. He uncovered that people the people who fill structural holes in the various existing networks derive social capital from their advantageous position. “network constraintmeasures” to detect the hole signatures was suggested by Burt (in [5]) to help identify structural holes. His social experiment was carried out in a commercial settings (in[3], where he analyzed a large electronics company), where he gathered information from questionnaires and discretely evaluated them.[4]His findings suggested that people who fill structural holes accrue various benefits by showing correlation between his constraint measures and good ideas, promotions, and higher compensation. With this it has been observed that leadership development practitioners are increasingly growing interest in social networks as a means to Development of However, in these three efforts, no author information has been considered, and the citation prediction is @ IJTSRD | Available Online @ www.ijtsrd.com | Volume – 1 | Issue – 5 | July-Aug 2017 Page: 741
International Journal of Trend in Scientific Research and Development (IJTSRD) ISSN: 2456-6470 3.1.ARCHITECTURE DIAGRAM identify communities, and organizations. Evaluation of good leadership has always been the main challenge faced by leadership practitioners, but by implementing Butt’s theory to identifying the members in the empty space and analyzing their overall performance, it will give a framework for conceptualizing the existing different types of leadership networks and in this case, in an academic environment. Social network analysis (SNA) being an evaluation approach it uses visual presentations mostly, therefore this paper will do so by giving the different visuals that can be expected against the actual results observed. ➢Objective 1: To bring out the connections in the network and try to understand how the members align to universities mandate in research and development using their areas of interest? ➢Objective 2: To deduct whether structural holes theory holds true in tertiary institutions and try to explore leadership skills can be identified by answering the unanswered question –of whether the faculty members who fill structural holes are indeed more successful researchers, contributors and key players. and strengthen institutions, fields, Fig 1.2 3.2.SAMPLE OUTPUT Fig 1.3 3.3.NETWORK DIAGRAM Fig 1.4 Fig 1.1 Structural hole Data that emerged the underlying network was collected from SRM University website for academic staff in the IT Department. Department consists of three branches namely: Big Data Analytics-BDA, Cloud Computing-CC and Information Security and Cyber Forensics-ISCF. @ IJTSRD | Available Online @ www.ijtsrd.com | Volume – 1 | Issue – 5 | July-Aug 2017 Page: 742
International Journal of Trend in Scientific Research and Development (IJTSRD) ISSN: 2456-6470 4.RESULT theory is true even for one attribute in consideration- the areas of interest. Fig 2.1 Network diagram with data The resulting network diagram brings out that the network has 107 links, where faculty member is identified as a node in the network and the link between them shows correlation between members with similar interests. Those nodes that fall in the bigger circle are the ones who have high homophily i.e. strong ties and greatly align to department mandate. The inner circle is a group of people who also form their own network inside the larger network. They show similar interest that span outside department core business but somehow align to the field of studies e.g. Robotics. The isolated nodes outside the network are the members who have different interests that do not align to department or any other member. The members are considered as outliers in the network. Fig 2.3 Designation vs. Count The graph in Fig 2.3 shows the number of faculty members against their designation. As noted the department has a high number of assistant professors but those who occupying the structural hole are in most cases of higher academic qualifications or higher rank designation. Fig 2.4 Cluster Diagram The clusters obtained visual show the members that are interested in a specific domain and their rank. For instance it can be noted that the Dr. and Associate proffessors are interested in information security, big data analytics and data mining concepts. With this it is safe to safe those with highere ranks are more interested in the current trending cutting edge technologies. Fig 2.2 Structural hole network nodes Fig 2.2 shows the network of faculty members that occupy the structural hole. It is further observed that these members are either in influential positions, have high ranks or are the senior most members of the institute. This suggests that Butt’s structural hole @ IJTSRD | Available Online @ www.ijtsrd.com | Volume – 1 | Issue – 5 | July-Aug 2017 Page: 743
International Journal of Trend in Scientific Research and Development (IJTSRD) ISSN: 2456-6470 Fig 2.7 Eigen Vector Centrality Fig 2.5 Heat Map Fig 2.5 shows the concentration of faculty members by their rank. Each position or academic merit title being assigned a rank e.g. Dr.-rank 7 Fig 2.8 Closeness The closeness values can be biased. This happens when a node can reach other nodes with the same distance but does not really represent the centrality. To eliminate this bias Eigen vector centrality is used (Fig 2.8). Fig 2.6 Standard Error 5.CONCLUSION AND FUTURE WORK This project analyzed an academic setting where faculty members have different areas of interest and the theory of structural hole proved to be true that those occupy the structural hole are more successful researchers and key players. Other than that, several interesting results were observed. Members who filled the structural hole also proved to be great leaders, eminent by the current positions they hold, being either head of department, former head of department, head of branch or related big posts. In future, it would yield great results if a more bigger setting would be observed where the areas of interest are not only limited to one department but the university as a whole or better yet two brother universities and see Fig 2.6 interprets that the faculty members whose areas of interest do not align with department mandate and field of study produce the highest error in the network, in such cases it is then suggested that these members should scaled out @ IJTSRD | Available Online @ www.ijtsrd.com | Volume – 1 | Issue – 5 | July-Aug 2017 Page: 744
International Journal of Trend in Scientific Research and Development (IJTSRD) ISSN: 2456-6470 how the faculty members influence the performance of the university, particularly the work of those who occupy the structural hole. 12)K. Balog, L. Azzopardi, and M. Rijke. Formal Models for expert findingin enterprise corpora. In SIGIR’06, 2006. 13)D. Blei, A. Ng, and M. Jordan. Latent dirichlet allocation. Journal ofMachine Learning, (3):993– 1022, 2003. 14)H. Deng, J. Han, M. Lyu, and I. King. Modeling and exploiting heterogeneous bibliographics networks for expertise ranking. In JCDL’11,2011. 15)E. EErosheva, S. Fienberg, and J. Lafferty. Mixed-membership publications. In Proc. of the National Academy Sciences,pages 5220–5227, 2004. 16)Y. Fang, L. Si, and A. Mathur, Discriminative Models of Integrating Document Evidence and Document-Candidate Associations for Expert Search. In 17)M. Rosen-Zvi, T. G. ad M. Steyvers, and P. Smyth. The Author-TopicModel for Authors and Documents. In UAI’04, 2004. 18)A. Anderson, S. KrawczykAnalyzing Stanford’s Academic Network REFERENCES 1)R. Burt. Structural holes: The social structure of competition. Belknap Pr, 1995. 2)R. Burt. The gender of social capital. Rationality and society, 10:5–46, 1998. 3)R. Burt. Structural Holes and Good Ideas 1. American journal of sociology, 110(2):349–399, 2004. 4)R. Burt. Structural Holes and Good Ideas 1. American journal of sociology, 110(2):349–399, 2004. 5)K. Balog, L. Azzopardi, and M. Rijke. Formal Models for expert findingin enterprise corpora. In SIGIR’06, 2006. 6)D. Blei, A. Ng, and M. Jordan. Latent dirichlet allocation. Journal ofMachine Learning, (3):993– 1022, 2003. 7)R Vidhya, G Vadivu, Research Document Search using Elastic Search, Indian Journal of Science and Technology 9 (37), 2016. 8)T. Y. J. Naga Malleswari , G. Vadivu, “Map reduce: A Technical Review”, Indian Journal of Science and Technology, Vol 9(1), January 2016. 9)K.Sornalakshmi, G.Vadivu, “A Survey on Realtime Analytics Framework for Smart Grid Energy Management”, International Journal of Innovative Research in Science, Engineering and Technology, March 2015. 10)Navin, G. Vadivu, “Big Data Analytics for Gold Price Forecasting Based on Decision Tree Algorithm and Support Vector Regression (SVR)”, International Journal of Science and Research (IJSR), March 2015. 11)G.Vadivu, Waheeta Hopper, “Ontology Mapping of Indian Medicinal Plants with Standardized Medical Terms”, Journal of Computer Science, ISSN 1549-3636., Aug, 2012. models of scientific SIGIR’10, 2010. @ IJTSRD | Available Online @ www.ijtsrd.com | Volume – 1 | Issue – 5 | July-Aug 2017 Page: 745