Download
1 / 7
70 likes | 77 Views
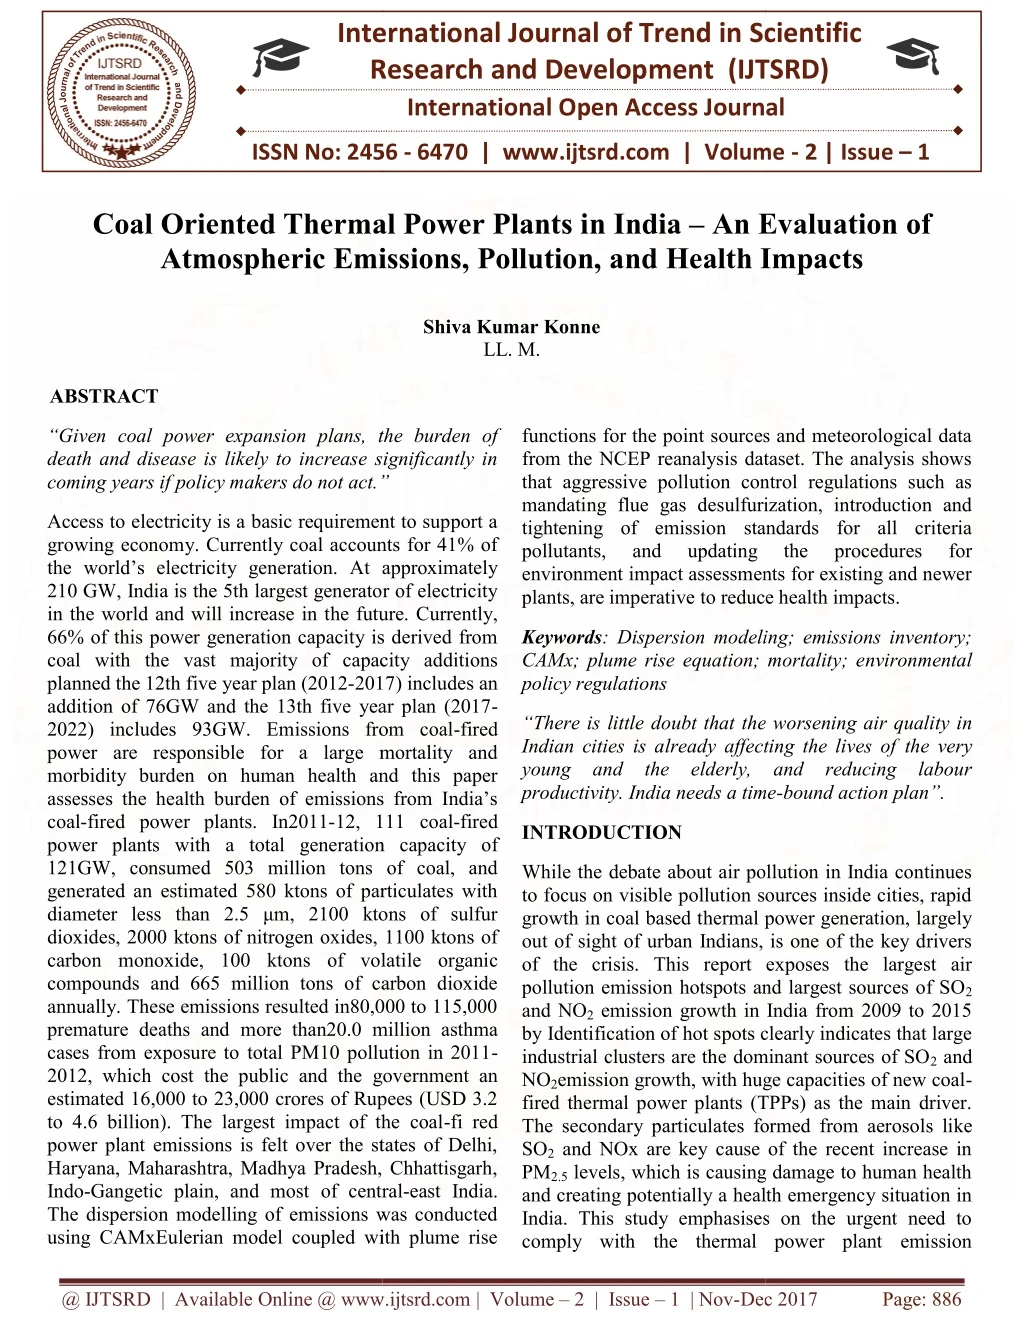
Access to electricity is a basic requirement to support a growing economy. Currently coal accounts for 41 of the world's electricity generation. At approximately 210 GW, India is the 5th largest generator of electricity in the world and will increase in the future. Currently, 66 of this power generation capacity is derived from coal with the vast majority of capacity additions planned the 12th five year plan 2012 2017 includes an addition of 76GW and the 13th five year plan 2017 2022 includes 93GW. Emissions from coal fired power are responsible for a large mortality and morbidity burden on human health and this paper assesses the health burden of emissions from India's coal fired power plants. In2011 12, 111 coal fired power plants with a total generation capacity of 121GW, consumed 503 million tons of coal, and generated an estimated 580 ktons of particulates with diameter less than 2.5 u00b5-m, 2100 ktons of sulfur dioxides, 2000 ktons of nitrogen oxides, 1100 ktons of carbon monoxide, 100 ktons of volatile organic compounds and 665 million tons of carbon dioxide annually. These emissions resulted in80,000 to 115,000 premature deaths and more than20.0 million asthma cases from exposure to total PM10 pollution in 2011 2012, which cost the public and the government an estimated 16,000 to 23,000 crores of Rupees USD 3.2 to 4.6 billion . The largest impact of the coal fi red power plant emissions is felt over the states of Delhi, Haryana, Maharashtra, Madhya Pradesh, Chhattisgarh, Indo Gangetic plain, and most of central east India. The dispersion modelling of emissions was conducted using CAMxEulerian model coupled with plume rise functions for the point sources and meteorological data from the NCEP reanalysis dataset. The analysis shows that aggressive pollution control regulations such as mandating flue gas desulfurization, introduction and tightening of emission standards for all criteria pollutants, and updating the procedures for environment impact assessments for existing and newer plants, are imperative to reduce health impacts. Shiva Kumar Konne "Coal Oriented Thermal Power Plants in India An Evaluation of Atmospheric Emissions, Pollution, and Health Impacts" Published in International Journal of Trend in Scientific Research and Development (ijtsrd), ISSN: 2456-6470, Volume-2 | Issue-1 , December 2017, URL: https://www.ijtsrd.com/papers/ijtsrd7111.pdf Paper URL: https://www.ijtsrd.com/other-scientific-research-area/enviormental-science/7111/coal-oriented-thermal-power-plants-in-india-u2013-an-evaluation-of-atmospheric-emissions-pollution-and-health-impacts/shiva-kumar-konne<br>

E N D
International Research Research and Development (IJTSRD) International Open Access Journal International Open Access Journal International Journal of Trend in Scientific Scientific (IJTSRD) ISSN No: 2456 - 6470 | www.ijtsrd.com | Volume Oriented Thermal Power Plants in India – An Evaluation ISSN No: 2456 | www.ijtsrd.com | Volume - 2 | Issue – 1 Coal Oriented Thermal Power Plants i Atmospheric Emissions, Pollution, a ospheric Emissions, Pollution, and Health Impacts An Evaluation of nd Health Impacts Shiva Kumar Konne LL. M. ABSTRACT “Given coal power expansion plans, the burden of death and disease is likely to increase significantly in coming years if policy makers do not act.” coming years if policy makers do not act.” “Given coal power expansion plans, the burden of death and disease is likely to increase significantly in functions for the point sources and meteorological data from the NCEP reanalysis dataset. The analysis shows ion control regulations such as mandating flue gas desulfurization, introduction and tightening of emission standards for all criteria pollutants, and updating environment impact assessments for existing and newer functions for the point sources and meteorological data from the NCEP reanalysis dataset. The analysis shows that aggressive pollution control regulations such as mandating flue gas desulfurization, introduction and tightening of emission standards for all criteria pollutants, and updating environment impact assessments for existing and newer plants, are imperative to reduce health impacts. to reduce health impacts. Access to electricity is a basic requirement to support a growing economy. Currently coal accounts for 41% of the world’s electricity generation. At approximately 210 GW, India is the 5th largest generator of electricity in the world and will increase in the future. Currently, 66% of this power generation capacity is derived from coal with the vast majority of capacity additions planned the 12th five year plan (2012-2017) includes an addition of 76GW and the 13th five year plan (2017 2022) includes 93GW. Emissions from coal power are responsible for a large mortality and morbidity burden on human health and this paper assesses the health burden of emissions from India’s coal-fired power plants. In2011-12, 111 coal power plants with a total generation capacity of 121GW, consumed 503 million tons of coal, and generated an estimated 580 ktons of particulates with diameter less than 2.5 μm, 2100 ktons of sulfur dioxides, 2000 ktons of nitrogen oxides, 1100 ktons of carbon monoxide, 100 ktons of volati compounds and 665 million tons of carbon dioxide annually. These emissions resulted in80,000 to 115,000 premature deaths and more than20.0 million asthma cases from exposure to total PM10 pollution in 2011 2012, which cost the public and the gov estimated 16,000 to 23,000 crores of Rupees (USD 3.2 to 4.6 billion). The largest impact of the coal power plant emissions is felt over the states of Delhi, Haryana, Maharashtra, Madhya Pradesh, Chhattisgarh, Indo-Gangetic plain, and most of central The dispersion modelling of emissions was conducted using CAMxEulerian model coupled with plume rise using CAMxEulerian model coupled with plume rise Access to electricity is a basic requirement to support a growing economy. Currently coal accounts for 41% of the world’s electricity generation. At approximately 210 GW, India is the 5th largest generator of electricity the the procedures procedures for for he future. Currently, 66% of this power generation capacity is derived from coal with the vast majority of capacity additions : Dispersion modeling; emissions inventory; CAMx; plume rise equation; mortality; environmental Keywords: Dispersion modeling; emissions inventory; CAMx; plume rise equation; mortality; e policy regulations 2017) includes an addition of 76GW and the 13th five year plan (2017- “There is little doubt that the worsening air quality in Indian cities is already affecting the lives of the very young and the elderly, and reducing labour “There is little doubt that the worsening air quality in Indian cities is already affecting the lives of young and the elderly, and reducing labour productivity. India needs a time productivity. India needs a time-bound action plan”. issions from coal-fired power are responsible for a large mortality and morbidity burden on human health and this paper assesses the health burden of emissions from India’s 12, 111 coal-fired tion capacity of INTRODUCTION 121GW, consumed 503 million tons of coal, and generated an estimated 580 ktons of particulates with diameter less than 2.5 μm, 2100 ktons of sulfur dioxides, 2000 ktons of nitrogen oxides, 1100 ktons of carbon monoxide, 100 ktons of volatile organic compounds and 665 million tons of carbon dioxide annually. These emissions resulted in80,000 to 115,000 premature deaths and more than20.0 million asthma cases from exposure to total PM10 pollution in 2011- 2012, which cost the public and the government an estimated 16,000 to 23,000 crores of Rupees (USD 3.2 to 4.6 billion). The largest impact of the coal-fi red power plant emissions is felt over the states of Delhi, Haryana, Maharashtra, Madhya Pradesh, Chhattisgarh, While the debate about air pollution in India continues to focus on visible pollution sources inside cities, rapid growth in coal based thermal power generation, largely out of sight of urban Indians, is one of the key drivers of the crisis. This report exposes the largest air pollution emission hotspots and largest sources of SO and NO2 emission growth in India from 2009 to 2015 by Identification of hot spots clearly indicates that large industrial clusters are the dominant sources of SO NO2emission growth, with huge capacities of new coal fired thermal power plants (TPPs) as the main driver. The secondary particulates formed from aer SO2 and NOx are key cause of the recent increase in PM2.5 levels, which is causing damage to human health and creating potentially a health emergency situation in India. This study emphasises on the urgent need to comply with the thermal power plant emission comply with the thermal power plant emission While the debate about air pollution in India continues to focus on visible pollution sources inside cities, rapid hermal power generation, largely out of sight of urban Indians, is one of the key drivers of the crisis. This report exposes the largest air pollution emission hotspots and largest sources of SO2 emission growth in India from 2009 to 2015 fication of hot spots clearly indicates that large industrial clusters are the dominant sources of SO2 and emission growth, with huge capacities of new coal- fired thermal power plants (TPPs) as the main driver. The secondary particulates formed from aerosols like and NOx are key cause of the recent increase in levels, which is causing damage to human health and creating potentially a health emergency situation in India. This study emphasises on the urgent need to of central-east India. The dispersion modelling of emissions was conducted @ IJTSRD | Available Online @ www.ijtsrd.com @ IJTSRD | Available Online @ www.ijtsrd.com | Volume – 2 | Issue – 1 | Nov-Dec 2017 Dec 2017 Page: 886
standards announced in December 2015 in order to solve the air pollution crisis faced by Delhi and many other parts of the country. The study also highlights the big sources of pollution over the larger geographical area where attention is urgently required to come up with a comprehensive and systematic National Action Plan on air pollution with time bound actions analysing satellite data High levels of toxic air pollution are a problem plaguing all of north India for several years now. In 2013, air pollution caused 1,800 deaths each day in India, up from 1,300 in 2000. Over this period, air pollution levels increased dramatically across India which can be attributed to various factors such as massive fossil fuel consumption, industrial growth, and increase in number of vehicles and rapid expansion in construction activities along with biomass burning at household level and in the agricultural fields. In a recent assessment done by Central Pollution Control Board (CPCB) based on the data generated by the National Ambient Air Quality Index showed that most of the cities in North India like Agra, Delhi, Faridabad, Gaya, Kanpur, Lucknow, Varanasi, Jaipur and Jodhpur are heavily polluted. The important thing to note about air pollution is the fact that it moves across long distances making it difficult to solve the issue in isolation by concentrating only on specific cities and sources. International Journal of Trend in Scientific Research and Development (IJTSRD) ISSN: 2456-6470 industrial clusters (Figure 1,2&3). The difference in NO2 emissions for the years 2009 and 2015 are shown below. The states of Uttar Pradesh, Rajasthan, Madhya Pradesh and Maharashtra shows very high columnar depth of NO2, at the same time the incremental concentration was highest in Chhattisgarh, Madhya Pradesh, Karnataka and Rajasthan. Muzaffarpur, Patna, TRENDS IN COAL CONSUMPTION IN INDIA The fossil fuel consumption in India has grown drastically over the last decade and most of this has come from expansion in the coal consumption increasing from 184 Mtoe(Million Ton Oil equivalent) in 2005 to 360 Mtoe in 2014. Most of the coal consumption has come from the increase in domestic coal mining with a noticeable increase in the imports over recent years from countries such as Indonesia, Australia and South Africa. The Indian coal has relatively low heating value and high ash content making the specific coal consumption high and releasing more pollutants into the atmosphere. Out of the total coal consumption in India, major share approximately 65% is consumed by the power utilities and nearly 6% by the captive power units. Average NO2 level in 2009 – 2010 (Figure 1) TRENDS IN NO2 CONCENTRATIONS Measurements of average NO2 levels in India reveal easily identifiable pollutant emission hotspots in coal thermal power plant clusters and steel industry complexes. The time series analysis of measurements from 2009 to 2015 (satellite data) shows a very dramatic increase in the NO2 emissions from these Average change in NO2 levels from 2009-2015 (Figure 2) @ IJTSRD | Available Online @ www.ijtsrd.com | Volume – 2 | Issue – 1 | Nov-Dec 2017 Page: 887
International Journal of Trend in Scientific Research and Development (IJTSRD) ISSN: 2456-6470 formed from SO2, NOx, ammonia and other “precursor” emissions through chemical atmosphere. Most of these secondary particles are linked to SO2 and NOx emissions from coal. In total, based on Dr. Chowdhury’s results, it is likely that at least ¼ of the PM2.5 pollution in Delhi is linked to coal. reactions in the ATMOSPHERIC EMISSIONS Coal based power plants in India The public sector operates most of the existing coal- fired power plants in India. The public sector entity - National Thermal Power Corporation (NTPC) was established in 1975 to accelerate the installation of pithead coal power plants and to supply to regional grids installed capacity of coal power grew at an average annual rate of 8% in the 1970s and at 10% in the 1980s. We used the list of thermal power plants documented by CEA (http://www.cea.nic.in) as a starting point for building our database of operational coal-fired power plants in the country. We updated this database for 2011-12 representing a total generation capacity of 121GW. We also include in the database, geographical location in latitude and longitude, number of boiler units and size of all known power plants operated by both public and private entities. This data was gathered from websites and annual reports of the state electricity boards for public and private sectors. A few large power plants are located on the coast, for the availability of cooling water from the sea and ease of importing coal. While the coastal winds are beneficial in some cases, the impacts are still at large for cities in the vicinity. For example, in Chennai (Tamilnadu) and Ahmedabad (Gujarat), each host two coal based power plants of more than 1000MW electricity generation and both of them are located closer to the city premises. Chennai, being a coastal city, records a smaller fraction of the power plant emissions in their ambient measurements, compared to Ahmedabad, which is in- land. In Delhi, up to 8% of the ambient PM pollution can be attributed to the coal based power plants of 2000MW generation capacity. In 2010, the Ministry of Environment and Forests (MoEF) published the results of a source apportionment study for six cities in India (Bangalore, Chennai, Delhi, Kanpur, Mumbai, and Pune), with information on the contributions of local transport, domestic, industrial, and power sectors to the ambient pollution (CPCB, 2010). For cities like Delhi, Chennai, Mumbai, Ahmedabad, Kolkata, and some medium to smaller size cities like Nagpur, Raipur, Ranchi, Kota, Bhatinda, Raichur, with power plants in the vicinity of 100km, do measure significant (5-30%) Average NO2 level in 2014-2015 (Figure 3) CASE STUDY Delhi and region around it A significant fraction of the particle pollution in Delhi are so-called secondary particles that are formed from pollutants such as SO2, NOx and ammonia in the atmosphere, rather than emitted directly, so focusing only on particulate matter (PM) emissions leaving aside SO2 and NO2 does not give an accurate picture of the sources of pollution. Industrial sources are responsible for nearly 90% of SO2, 52% of NOx and 11% of PM2.5 emissions load in Delhi, most of these pollutants are emitted from the power plants; the sulfate and nitrate particles formed from SO2 and NOx pollution, respectively, are key contributors to the total PM2.5 pollution. In comparison, the most often cited emissions from vehicles, approximately 1% of SO2, 36% of NOx and 20% of PM2.5 emissions load from the city. This excludes emissions from sources outside the city boundary. There are 16 coal-fired units (2,824MW) within 50 kilometers from the center of New Delhi, and 114 units (26,874 MW) within 500km. Depending on wind direction and other atmospheric conditions, these power plants and other large coal-burning industries can make a very significant contribution to Delhi’s air pollution. Even more alarmingly, nine more coal-fired units (5,530MW) are under construction and 36 units (28,040MW) are in pipeline within the 500km radius of the capital. If realized, these plants could more than double the coal-fired generating capacity and associated air pollution emissions within the region. A team of researchers led by Dr. Zohir Chowdhury analyzed the chemical composition of the wintertime PM2.5 pollution in Delhi, and found out that 1/6thwas soot and dust from coal burning, and 1/4th was secondary particulates is responsible for @ IJTSRD | Available Online @ www.ijtsrd.com | Volume – 2 | Issue – 1 | Nov-Dec 2017 Page: 888
ambient contributions from these point sources. International Journal of Trend in Scientific Research and Development (IJTSRD) ISSN: 2456-6470 power plants in and surrounding Delhi metropolitan area, based on the reported measurements, which tend to underestimate the contribution of power plant emissions to the region. Similarly, based on intermittent measurements Cropper estimated average emissions of 110kons/year for PM2.5 from 92 coal fi red power plants. For NOx, studied the influence of thermal power plants on tropospheric NO2 column measurements from the ozone monitoring instrument (OMI) onboard aura satellite (http://aura.gsfc.nasa. gov) and also studied the algorithm to deduce ground level concentrations, which could reflect the power plant emissions. This study particularly highlights the cluster regions over the states of Delhi, Haryana, Indo- Gangetic plains, and most of central India with the highest concentrations possibly originating from the power plants. Lu and Streets (2012) also studied the satellite data and further estimated the emissions based on boiler size and coal consumed for the period between 1996 and 2010, which overlays the changes in satellite observations to the newer installations and extensions commissioned during this period. They estimated a 70% increase in the column NOx concentrations during this period, with the power plants contributing a total estimated 2300 ktons NOx emissions for 2010. There are no legally mandated emission standards for SO2. Only a handful of coal-fi red power plants operate flue gas desulfurization (FGD) units and among those to be commissioned through 2020, only 7 power plants are listed to have FGD. The FGD systems could range from in furnace control via limestone injection, wet scrubbing of flue gas, to capturing SO2 in the flue gas through industrial processes. Presence of FGD at the plants further improves removal of PM. In India, for SO2, only the stack heights are mandated assuming that the emissions will be dispersed to farther distances and thus diluting the ambient concentrations. For example, MoEF requires all power plants with generation capacity more than 500MW to build a stack of 275m; those between 210MW and 500MW to build a stack of 220m; and those with less than 210MW to build a stack based on the estimated SO2 emissions using a thumb rule of height = 14*(Q)0.3 where Q is the estimated SO2 emissions rate in kg/hr. The stack heights for old and new power plants ranged between 150m and 275m. Despite an estimated 30% of the total NOx emissions in India originating from power generation, currently, there are no regulations to control these emissions for coal fi red power plants. Some of the new installations and extensions are equipped with low NOx burners, with little details on their operational performance. Few studies have reported emission rates and total emissions from the power plants in India. One national emissions inventory for the coal and gas based power plants is maintained by the GAINS program at the International Institute for Applied Systems Analysis, which for the base year 2005, estimated total emissions of 490 ktons for PM2.5, 1900 ktons for SO2, 1300 ktons for NOx, 43 ktons of VOCs. A major difference between this inventory and our study is in the database of plants, which we updated for the new installations and extensions for the existing plants, and assumed control efficiencies. A database of coal characteristics, control efficiencies, and emission rates is available online. Another global emissions inventory by specific sectors is EDGAR with estimates for base year 2008. Average emission factors for PM, SO2, NOx, CO, and BC for all combustion sectors for base year 2000 are presented in Streets. The CEA also reports, as part of the performance evaluation of the thermal power plants, the emissions for total suspended PM in mg/Nm3. Since, these are not continuous measurements and mostly observed at select times during the year, it was difficult to either confirm or reject the estimates based on them studied the emissions from six coal and gas based PARTICULATE POLLUTION The atmospheric dispersion simulation are carried out for 11 days per month from 10th to 21st of each month and averaged to obtain monthly, seasonal, and annual concentrations. The modelled annual average PM10 and PM2.5concentrations due to emissions from coal based power plants. These totals include both the primary PM and secondary PM – from chemical conversion of SO2Ox emissions to sulfates and nitrates, respectively. The coarse/fine bins are modelled independently with varying dry and wet deposition schematics, predefined in the CAMx model. For PM10, the sum includes coarse, fine, sulfate, and nitrate concentrations and for PM2.5 the sum includes only fine, sulfate, and nitrate concentrations. The national ambient annual average standard for PM10 is 60μg/ m3 and the WHO guideline is 20μg/m3. The national ambient annual average standard for PM2.5 is 40μg/ m3 and the WHO guideline is 10μg/m3. While the absolute values in may seem small, this should be considered as incremental pollution which the population in the region is exposed to, besides the pollution from transport, domestic, and other industrial activities, on an annual basis. The PM2.5 concentrations were overlaid on the annual average concentrations retrieved from 2001-06 satellite @ IJTSRD | Available Online @ www.ijtsrd.com | Volume – 2 | Issue – 1 | Nov-Dec 2017 Page: 889
observations to estimate the percentage contribution of power plant emissions to the ambient concentrations in India. The data from the satellite observations has large uncertainty, since the retrieval methodology could not be corroborated with a large enough PM2.5 monitoring data sample, and tend miss the urban peaks in the southern India. However, this provides an immediate baseline for the comparison, to identify hotspots, and to estimate contributions. The largest impact of the coal- based power plant emissions is felt over most of the central-east India including states of Maharashtra, Madhya Pradesh, Chhattisgarh, and Orissa, with the highest and the largest coal based power plants. International Journal of Trend in Scientific Research and Development (IJTSRD) ISSN: 2456-6470 report (2016) done on Delhi & NCR has found that secondary particle contributes to approximately 30% of total PM2.5 concentration over the region. This establishes the close relationship between the overall PM2.5 concentration and secondary particles. Major contributors to the secondary particulate formation are precursor gases such as SO2, NOx and Ammonia. An estimated 75 - 90% of sulphates and 50% nitrates are formed from SO2 and NOx emissions originating from the stacks of thermal power plants. Analysis of satellite based imagery done by Greenpeace shows the SO2 and NO2 hotspots in the country and it overlaps with the high coal consuming regions clearly proving the following: Discussion HEALTH IMPACTS 1) SO2 and NO2 emissions are very high within the regions where coal burning is high eg:Singrauli ( UP & MP), Korba (Chhattisgarh),Raigarh (Chhattisgarh), Angul (Odisha), Mundra(Gujarat), (Maharashtra), Bellary (Karnataka) and Chennai and Neyveli (Tamil Nadu) regions and The direct link between emissions (from transport, power plants, household cook stoves, industries, and fugitive dust), outdoor air pollution, and human health has been extensively documented Most notable of the health impacts resulting in premature deaths include chronic obstructive pulmonary respiratory infections, cerebro vascular disease, ischemic heart disease, and cancers of trachea, bronchitis, and lung. Of all the pollutants, the public health concerns in India are focused on PM that contributes to a host cardiopulmonary ailments and increasing the risk of premature death. Epidemiological studies conducted in India (Delhi and Chennai) under the public health and air pollution in Asia (PAPA) program also highlighted the linkages between outdoor air pollution and premature mortality, hospital admissions, and asthma cases. The morbidity and mortality burden is particularly costly for governments in terms of work days lost, lost productivity, and loss in terms of gross domestic product. Since, the most PM related deaths occur within a year or two of exposure, reducing PM pollution from sources like transport and power plant has almost immediate benefits for health and national economy. Chandrapur disease, lower 2) There is a significant increase in emissions of SO2 and NO2 with the capacity addition of thermal power in clusters like Mundra, Raigarh, Korba, Angul, SIngrauli and Bellary. of respiratory and Indian government notified the revised emission standards for thermal power plants in December 2015. The ambitious standard requires the power producers to comply within two years from the date of notification. The notifications puts a cap on SO2and NOx for the first time in India and have stricter emission limits for particulate matter along with new norms for water consumption by the thermal power plants. Currently only about 10% of the thermal power plants have desulphurization devices. implementation of the new notified standard a huge task for both the industry and the government. To ensure compliance within the stipulated timeframe would require systematic and time bound action from all stakeholders, especially from the industry. Government has also taken steps to implement continuous real time emission monitoring system for 17 polluting industries and a direct alert system to the ministry when a particular industry is violating the emission norms. The government also has plans to introduce a Bill in the parliament to provide legal validity for this data for it to be submitted in the court of law. This makes the DISCUSSION Various researchers suggest that a major portion of the PM emission in the country comes from the industrial sector, especially from coal based thermal power plants. A significant share of India’s total PM emission is also contributed by secondary particles formed by SO2and NO2 emitted from thermal power plants. Study from Behara and Sharma (2010) on Kanpur city estimated approximately secondary particles (inorganic aerosols) to the total PM2.5 concentration levels and a recent IIT Kanpur 34% contribution of From the analysis and the discussion above its very apparent that thermal power plant emissions play a very significant role in the increase of PM2.5 levels across @ IJTSRD | Available Online @ www.ijtsrd.com | Volume – 2 | Issue – 1 | Nov-Dec 2017 Page: 890
the country through secondary particulate formation from SO2 and NO2. While there are many initiatives taken at the level of individual cities, it’s clear that initiatives need to be taken at a regional level in order to solve the air pollution crisis. China has successfully reduced SO2 and NOx emissions by 50% and 30%, respectively, from 2010 to 2015, by requiring power plant and industrial plant operators to install emission control devices and by enforcing new emission standards, while reducing total coal consumption. The result has been dramatic reductions in PM2.5 pollution levels across eastern China in the past two years, even though pollution levels remain hazardous. Air pollution crisis peaked in China in 2013, which lead to the state taking stronger measures to curb air pollution by way of National Action Plan, 2013. The Air Pollution Action Plan was enacted with putting caps of coal consumption limiting new coal power addition in three key air pollution regions. The coal consumption cap was also set by sectors wherein for power sector it was capped at 1.86 billion tonnes. International Journal of Trend in Scientific Research and Development (IJTSRD) ISSN: 2456-6470 4.Regularly monitor power sector progress in complying with the new emission standards, including reporting on timeline for ordering and installing pollution control devices. 5.Update the regulatory framework for enforcing power plant emission substantial automatic fines for every violation of emission limits, as are used in China and the U.S. standards, including 6.Make it mandatory for the industries and thermal power plants to display real time air emission data available on public platforms. REFERENCE 1.Global Burden of Diseases, 2013, 2.www.urbanemission.info 3.CPCB, 2016; NAQI STATUS OF INDIAN CITIES IN 16,http://cpcb.nic.in/upbl/upload/latest/latest-19- naq%20status 20%indian cities2015.pdf 2015- Ultimately, the government and citizen groups need to demand clean power, keeping in mind the health impacts of the emissions from power plants in India. An environmental outlook study concluded that a least- cost policy mix to reduce air pollution in the developing economies of Brazil, China, India, and South Africa is made up of 50% end of pipe measures and 50% of shifting to cleaner energy sources (OECD, 2012). In the future – while the share of power generation from coal is projected to decline (IEA, 2012) – the amount of power generated from coal will remain high at least through 2030, and unless we find a better way to manage the power plants, the environmental effects due to growing air and CO2 emissions and the human health cost will be high. 4.Sharma and Dikshit, 2016; Comprehensive Study on Air Pollution and Green House Gases (GHGs) in Delhi. IIT Kanpur, Environment/PDFs/Final_Report.pdf http://delhi.gov.in/DoIT/ 5.BP Statistical review of World’s Energy 2015, http://www.bp.com/ content/dam/bp/excel/energy- economics/statistical-review-2015/bpstatistical- review-of-world-energy-2015-workbook.xlsx. 6.Ministry of Coal, 2016; Annual Report 2015-2016, http://www.coal.nic.in/sites/upload- fils/coal/files/coalupload/chap6annualreport1415en. pdf 7.Sharma and Dikshit, 2016; Comprehensive Study on Air Pollution and Green House Gases (GHGs) in Delhi. IIT Kanpur, Environment/PDFs/Final_Report.pdf Way Forward: 1.Set a deadline for meeting the national air quality standards e.g. 5-year interim targets for reducing pollution levels in each state and city that doesn't currently comply. http://delhi.gov.in/DoIT/ 8.Global http://endcoal.org/global-coalplant- tracker/ Coal Plant Tracker, March 2016, 2.Create a regional action plan covering the extremely highly polluted areas from Punjab to West Bengal, addressing all major air pollution emitting sectors. 9.Chowdhary et al., 2007; Speciation of ambient fine organic carbon particles and source apportionment of PM2.5 in Indian cities. Journal of Geophysical Research http://onlinelibrary.wiley.com/doi/10.1029/2007JD 008386/full Atmospheres, 3.Set targets for reducing interstate pollution, including compliance plan for meeting the new thermal power plant emission standards, 2015, as soon as possible. @ IJTSRD | Available Online @ www.ijtsrd.com | Volume – 2 | Issue – 1 | Nov-Dec 2017 Page: 891
10.Platts world electric power plants database 2015Q4, http://www.platts.com/udi-data-directories International Journal of Trend in Scientific Research and Development (IJTSRD) ISSN: 2456-6470 12.N. A. Krotkov et al. 2016: Aura OMI observations of regional SO2 and NO2 pollution changes. Atmos. Chem. Phys., 16, 4605–4629. http://www. atmos- chem-phys.net/16/4605/2016/acp-16-4605-2016.pdf 11.MoEF&CC, Achievements of the Ministry of Environment, Forest and http://pib.nic.in/newsite/PrintRelease.aspx?relid=13 3974 Dec 2015; Highlights of the 13.CHINA COAL CONSUMPTION CAP PLAN AND RESEARCH REPORT: Recommendations forthe13thFiveYearPlan,October2015,http://d2ouvy 59p0dg6k.cloudfront.net/downloads/china_coal_co nsumption_ cap_plan_and_research_report__recommendations_ for_the_13fyp.pdf Climate Change, @ IJTSRD | Available Online @ www.ijtsrd.com | Volume – 2 | Issue – 1 | Nov-Dec 2017 Page: 892