Download
1 / 7
70 likes | 75 Views
Mathematics is one of the core subjects in secondary education different modern concepts and methods are introduced in the syllabus of mathematics at secondary stage. The curriculum revision is being undertaken by the state department of education (SCERT) and the central department of education (NCERT) constantly and all the modern mathematics is incorporated at the secondary stage. The teacher education programs for preparing mathematics teachers are also strength and during the past to ducats whenever the curriculum is changes different researching programs such as refresher courses, seminars, workshops etc., are conducted to make true teaching of mathematics more effective in secondary schools.Hence in this paper it is proposed to undertake teacher wise and student wise analysis for this study keeping in view of certain variables like sex, locality, qualification, experience etc., and develop a tool to measure teaching effectiveness of mathematics teachers and also to understand the type of relationship between the teaching effectiveness and its relation to student achievement. The collected is analyzed by descriptive and inferential statistics Dr. Y. Raghunatha Reddy | Dr. Shaik Thajoddin | Arif Khan, Dr. S.Makbul Hussain"A Study on Teaching Effectiveness of Mathematics" Published in International Journal of Trend in Scientific Research and Development (ijtsrd), ISSN: 2456-6470, Volume-1 | Issue-4 , June 2017, URL: http://www.ijtsrd.com/papers/ijtsrd141.pdf http://www.ijtsrd.com/mathemetics/statistics/141/a-study-on-teaching-effectiveness-of-mathematics/dr-y-raghunatha-reddy<br>

E N D
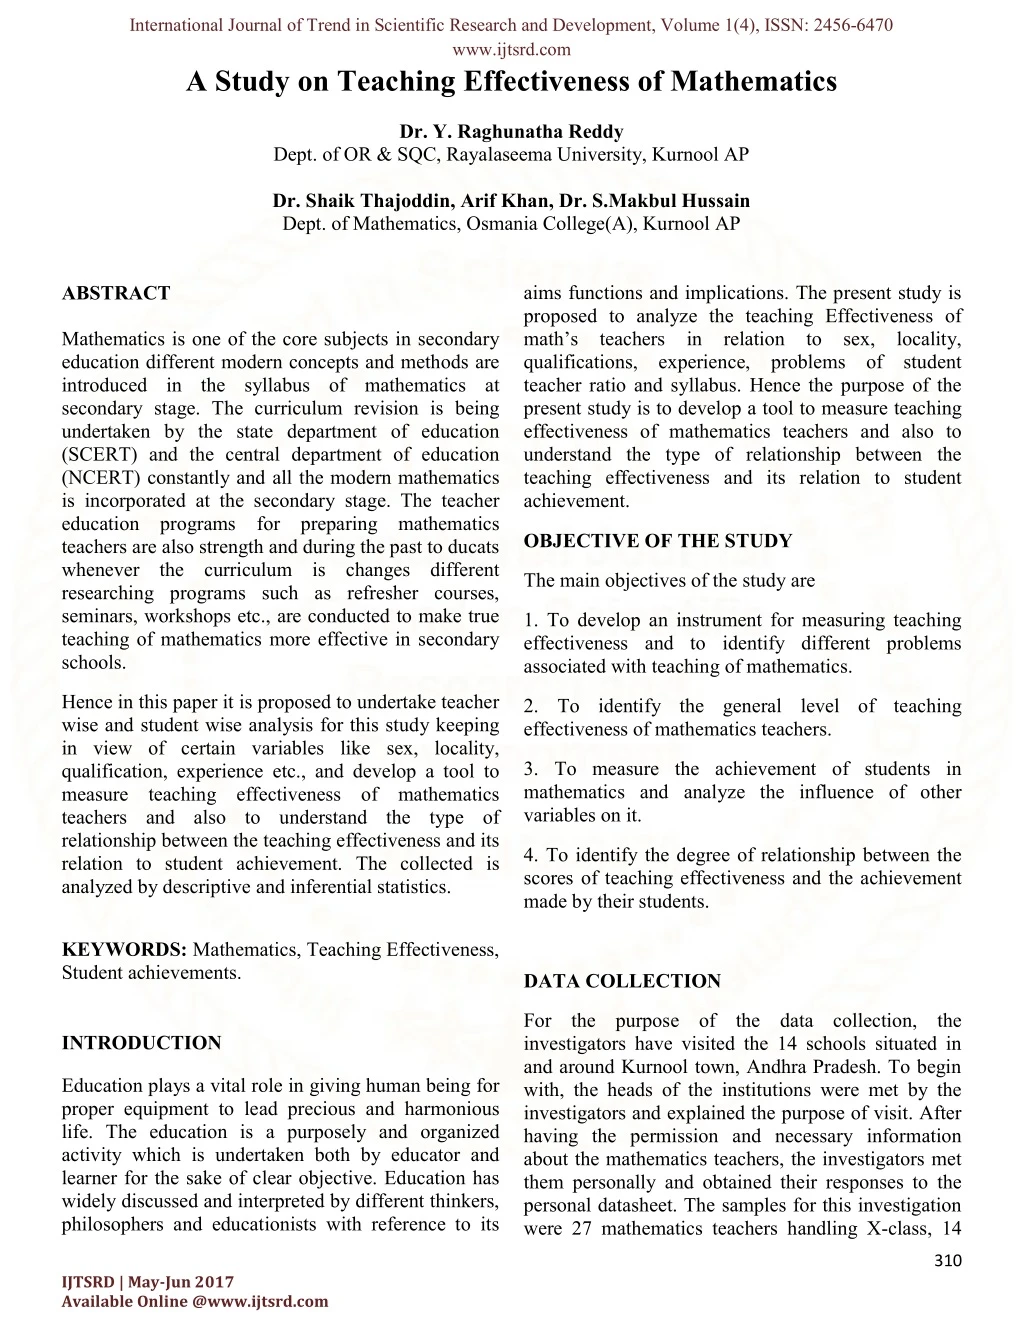
International Journal of Trend in Scientific Research and Development, Volume 1(4), ISSN: 2456-6470 www.ijtsrd.com A Study on Teaching Effectiveness of Mathematics Dr. Y. Raghunatha Reddy Dept. of OR & SQC, Rayalaseema University, Kurnool AP Dr. Shaik Thajoddin, Arif Khan, Dr. S.Makbul Hussain Dept. of Mathematics, Osmania College(A), Kurnool AP aims functions and implications. The present study is proposed to analyze the teaching Effectiveness of math’s teachers in relation to sex, locality, qualifications, experience, problems of student teacher ratio and syllabus. Hence the purpose of the present study is to develop a tool to measure teaching effectiveness of mathematics teachers and also to understand the type of relationship between the teaching effectiveness and its relation to student achievement. ABSTRACT Mathematics is one of the core subjects in secondary education different modern concepts and methods are introduced in the syllabus of mathematics at secondary stage. The curriculum revision is being undertaken by the state department of education (SCERT) and the central department of education (NCERT) constantly and all the modern mathematics is incorporated at the secondary stage. The teacher education programs for preparing mathematics teachers are also strength and during the past to ducats whenever the curriculum is changes different researching programs such as refresher courses, seminars, workshops etc., are conducted to make true teaching of mathematics more effective in secondary schools. OBJECTIVE OF THE STUDY The main objectives of the study are 1. To develop an instrument for measuring teaching effectiveness and to identify different problems associated with teaching of mathematics. Hence in this paper it is proposed to undertake teacher wise and student wise analysis for this study keeping in view of certain variables like sex, locality, qualification, experience etc., and develop a tool to measure teaching effectiveness of mathematics teachers and also to understand the type of relationship between the teaching effectiveness and its relation to student achievement. The collected is analyzed by descriptive and inferential statistics. 2. To identify the general level of teaching effectiveness of mathematics teachers. 3. To measure the achievement of students in mathematics and analyze the influence of other variables on it. 4. To identify the degree of relationship between the scores of teaching effectiveness and the achievement made by their students. KEYWORDS: Mathematics, Teaching Effectiveness, Student achievements. DATA COLLECTION INTRODUCTION For the purpose of the data collection, the investigators have visited the 14 schools situated in and around Kurnool town, Andhra Pradesh. To begin with, the heads of the institutions were met by the investigators and explained the purpose of visit. After having the permission and necessary information about the mathematics teachers, the investigators met them personally and obtained their responses to the personal datasheet. The samples for this investigation were 27 mathematics teachers handling X-class, 14 Education plays a vital role in giving human being for proper equipment to lead precious and harmonious life. The education is a purposely and organized activity which is undertaken both by educator and learner for the sake of clear objective. Education has widely discussed and interpreted by different thinkers, philosophers and educationists with reference to its 310 IJTSRD | May-Jun 2017 Available Online @www.ijtsrd.com
International Journal of Trend in Scientific Research and Development, Volume 1(4), ISSN: 2456-6470 www.ijtsrd.com heads of Institutions and 270 students of X-class from 14 schools selected with the help of 27 mathematics 10 regular students from X-class handled by them were selected at random and thus, the total number of students included in the present study were 270. These were taken away from their respective classes and accommodated in a separate room. They were explained the purpose of present study and requested to fill up the ratings on the performance of math’s teachers while he was involved in teaching learning activity and the achievement test in mathematics was administrated. After completion of the investigation the investigators obtained the ratings from the heads of the institutions and students of X-class on the teaching effectiveness of math’s teachers. General knowledge and common sense Enthusiasm in doing things and getting things done by the student Honesty and sincerity in work 2) ACHIVEMENTS IN MATHESMATICS According to dictionary of education “Academic achievement means knowledge attained or skills developed in schools subjects” usually designated by test scores or marks assigned by teachers. Achievement test are used to measure the relative accomplishment of pupils in the specified areas of learning. Achievement in mathematics means the score secured by the students in a unit achievement test in mathematics prepared to measure the expected outcome. The personal data sheet means it includes the name of the teacher, locality, qualifications’ and experience. In the same sheet a few questions were raised to collect their opinions about different problems faced by them in teaching mathematics such as problem of teacher pupil ratio, accommodation, teaching learning material, timetable, language problem, problems of students in understanding conducting in mathematics club, feeling difficult in teaching mathematics etc. The independent variable sex, locality, qualifications, experience, problem of pupil teacher ratio, problem of accommodation, problem of syllabus and problem of lack of knowledge in the fundamentals. teaching, activities ABOUT THE SCORING THE RESPONSES ABOUT THE VARIABLES For the purpose of scoring the rating numerical weights were assigned from 0 to 10 here0 is the minimum score and 10 is the maximum score, 5 and 6 are the middle scores. The numerical weights obtained by each student on the 10 aspects were added and divided by 10 to get the average rating given by each subject. This average is added to overall rating given by head of institutions and averaged to get the final rating. Thus each math’s teacher got 10 students ratings and one head of the intuition rating. Dependent variables in this study are teaching effectiveness and achievement in mathematics, a brief discussion about the dependent variables which were included in the study is as follows 1) TEACHING EFFECTIVENESS In the dictionary of education BENGIMEN define teaching efficiency as the” Degree of success of a teacher in performing instructional and other duties specified in his position”. The teaching effectiveness of secondary school mathematics is measured by obtaining rating from both head of the instructions on overall rating on the efficiency of the teacher and students of X-class selected at random on To give equal weight ages for both students rating and head of the intuitions rating 10 students rating were averaged and added to head rating and finally averaged. This was termed as a composite index of teaching effectiveness. The achievements test were also obtained by assigned the numerical weights of “2” or “1” to correct responses as the case may be and “0” for wrong answers the total scores thus obtained were also tabulated. The information obtained from the personal data sheet was also coded appropriately for the purpose of analyzes the data and interpretation of results. Knowledge in the subject matter Interest in teaching Preparation for teaching Discipline skill in class management Clarity in expression Expertise in teaching methods Moral values 311 IJTSRD | May-Jun 2017 Available Online @www.ijtsrd.com
International Journal of Trend in Scientific Research and Development, Volume 1(4), ISSN: 2456-6470 www.ijtsrd.com STATISTICAL ANALYSIS Frequency Smoothed … 10 As it was mentioned already a questionnaire was administered on mathematics teachers to obtain the data and relevant information concerning teaching mathematics. The data where carefully analyzed by employing appropriate statistical techniques was used. The description of the two dependent variables namely teaching effectiveness of 27 math’s teachers and achievement in mathematics by 270 students were also made by presenting frequency distribution and computing all descriptive statistics such as mean, median, mode, range, quartile deviation, standard deviation, skewness and kurtosis. To test the different hypothesis “t-test” and “F-ratio” where employed appropriately. 8 6 4 2 0 Scores ANALYSIS: The index of the teaching effectiveness scores spread from 4.52 to 9.92 the range is 5.42 the mean of the teaching effectiveness scores is 7.46 it indicates the teachers are in general or above average in their teaching effectiveness. The midpoint on the ratings scale is 5.00. The average, which was obtained, is far greater than the midpoint, hence it is concluded that the majority teachers were effective in their teaching mathematics. The median and mode value are 7.56 and 7.76 respectively indicate that there exists a little difference to the symmetry in the distribution. The calculated value of skewness is –0.232 also confirms that the distribution is slightly skewed towards negative direction. Frequency distribution – Description of the distribution of scores 1)Teaching effectiveness scores The teaching effectiveness of math’s teachers was measured by obtaining rating from the respective heads of the intuitions and 10 students of X-class who were taught by teacher atleast for one year. Thus a composite index was obtained to refer the teaching effectiveness of math’s teachers. The teaching effectiveness scores were given in the following table. The Q.D and S.D values are 0.957&1.291 respectively .The empherical relationship between these two measures in the case of normal distribution is (2/3*S.D)=Q.D Table (1) shows the frequency distribution of teaching effectiveness scores. Scores 4.0- 4.9 1 5.0- 5.9 3 6.0- 6.9 5 7.0- 7.9 8 8.0- 8.9 7 9.0- 9.9 3 This type of relation between two measures of the distribution in hand (2/3* 1.291)=0.86. It reveals that the distribution is slightly deviating from normality. No of teacher Smoothed frequency 1.33 3 5.33 6.67 6 3.33 The measure of kurtosis 0.271 indicates that distribution is plato-kurtic as it is greater than meso- kurtic value is 0.263. Mean = 7.46 Q.D =0.957 2)ACHIVEMENT SCORES To measure the achievement scores an achievement test was prepared by the investigator and the scores obtained on the test where considered as level of achievement in mathematics. The distribution of achievement scores are shown in the table (2) Median =7.56 S.D =1.291 Mode =7.76 Skewness=– 0.232 Range =5.42 Kurtosis =0.271 312 IJTSRD | May-Jun 2017 Available Online @www.ijtsrd.com
International Journal of Trend in Scientific Research and Development, Volume 1(4), ISSN: 2456-6470 www.ijtsrd.com TABLE (2) SHOWS THE DISTRIBUTION OF MATHEMATICS ACHIEVEMENT TEST SCORES the skewness is 0.046 also confirms that the distribution is positively skewed to the little extent. The Q.D & S.D are 8.701&12.97 respectively the empirical relationship between these two measures in the case of normal distribution is 2/3*S.D. This type of relationship between the two measures of the distribution is 2/3*12.97=8.65. Scores 11- 20 4 21- 30 28 31- 40 53 41- 50 97 51- 60 58 61- 70 19 71- 80 8 81- 90 3 No of Student s Cumula tive frequen cy Smooth ed frequen cy 4 32 85 18 2 240 25 9 26 7 27 0 From the above it reveals that the distribution is slightly deviating from normality. The measure of kurtosis is 0.261 is slightly less than the meso-kurtic value 0.263 and therefore it can be seen that the distribution is leptokurtic. In the frequency polygon and smoothed frequency are drawn and showed in the figure and it can also be disclosed that the scores of mathematics achievement follows normality with a little deviation. 10.7 28.3 59.3 69.3 58 28.3 10 3.67 Mean =45.91 Q.D =8.701 Median = 45.65 S.D =12.97 TEACHER AND STUDENT WISE ANALYSIS WITH REGARDING VARIABLES TO CERTAIN Mode =45.13 Skewness=0.046 Range =72 Kurtosis =0.261 Mathematics is one of the core subjects in secondary education different modern concepts and methods are introduced in the syllabus of mathematics at secondary stage. The curriculum revision is being undertaken by the state department of education (SCERT) and the central department of education (NCERT) constantly and all the modern mathematics is incorporated at the secondary stage. The teacher education programs for preparing mathematics teachers are also strength and during the past to ducats whenever the curriculum is changes different researching programs such as refresher courses, seminars, workshops etc. are conducted to make true teaching of mathematics more effective in secondary schools. Hence it is proposed to undertake teacher- wise and student-wise analysis for this study keeping in view of certain variables like sex, locality, qualification, experience etc. 120 Frequency 100 80 60 40 20 0 11-20. 21-30 31-40 41-50 51-60 61-70 71-80 81-90 Scores RESULTS: The mathematics achievement scores spread from 12 to 84. The range is 72 the mean of the mathematics scores is 45.91 it shows that the level of achievement of X-class students in mathematics is just below average. The median and mode values are 45.65&45.13 respectively indicates that there exists a little deviation to the symmetry in the deviation. OBJECTIVE The objective of this study is to analyze the teaching effectiveness of teachers and achievement level of students with respect to certain variables. It can be seen in table (2.1) that the distribution of the scores as positive skewness. The calculated value of 313 IJTSRD | May-Jun 2017 Available Online @www.ijtsrd.com
International Journal of Trend in Scientific Research and Development, Volume 1(4), ISSN: 2456-6470 www.ijtsrd.com HYPOTHESIS: TABLE COMPARED TO DIFFERENT VARIABLES 3: TEACHING EFFECTIVENESS Male and female teachers would not differ significantly in their teaching effectiveness and in the achievement level of their students. There is no significant difference in teaching effectiveness of rural and urban teachers and in the achievement of their respective students. There is no significant difference between PG and non-PG teachers in their teaching effectiveness and the achievement made by their students. There would not be any significant difference in teaching effectiveness of more experience and less experience and in achievement of their respective students. There would be significant difference between teachers who felt the problem of student teacher ratio and who did not felt problem student teacher ratio and in the achievement of their students. There would not be significant difference between teachers who felt with the problem of syllabus and who did not feel the problem of syllabus and in the achievement of their students. There exists no significant difference in achievement mean rating given by boys and girls and teaching effectiveness of their teachers. There exists no significant difference in achievement mean rating given by rural and urban students and teaching effectiveness of their teachers. Category Sample Mea SD ‘t’ value 0.894 n 7.58 7.04 7.62 7.43 7.81 7.34 Male Female 6 Rural Urban 23 PG Non PG 5 years > 5 years Faced prob. No prob. Faced prob. No prob. 21 1.29 1.18 1.20 1.30 1.17 1.29 Gender 4 0.2531 Area 7 20 0.833 Education qualificati on Experience 8 6.75 1.31 1.747 19 7.76 1.26 16 7.28 1.27 0.8695 Student – Teacher Ratio 11 7.72 1.21 17 7.61 1.32 0.742 Syllabus 10 7.21 1.27 TABLE 4: ACHIEVEMENT COMPARED TO DIFFERENT VARIABLES Category n Mean SD ‘t’ value Male Female 6 Rural Urban PG Non PG 5 yrs > 5 yrs Faced prob. No prob. Faced prob. No prob. 21 48.4 37.1 4 44.7 23 46.1 7 54.4 20 42.9 11.8 1.893 12.0 10.3 0.210 12.0 12.0 2.060 11.4 Gender ANALYSIS Area Education qualification To study the influence of various personal and demographic variables on teaching effectiveness, t- test and analysis of variance (ANOVA) were applied appropriately to the hypothesis. 8 19 49.8 16 42.76 11.2 1.657 36.6 11.5 2.1598 11.3 Experience There are 6 variables under the category as already mentioned. Each of them was considered separately to see whether they influence significantly the teaching effectiveness and achievement level of students in mathematics. Student – TeacherRatio 11 50.53 11.8 17 47.33 11.5 0.796 Syllabus 10 43.54 11.3 314 IJTSRD | May-Jun 2017 Available Online @www.ijtsrd.com
International Journal of Trend in Scientific Research and Development, Volume 1(4), ISSN: 2456-6470 www.ijtsrd.com Table 5: Student-wise analysis regarding teaching effectiveness of their teachers experience is not significantly influencing the teaching effectiveness teachers. The calculated t-value is far less than critical value at 5% LOSand it is concluded that the problem of student teacher ratio is not significantly influencing effectiveness of mathematics teachers. From the above table the calculated value of t (0.742) is far less than critical value at 5% LOS, therefore the null hypothesis is accepted. Hence there exists difference between due to sampling fluctuations only. of mathematics Category Sample Mean SD ‘t’ value Gender Boys 179 91 40 7.54 7.65 8.06 7.50 1.068 0.786 1.097 1.117 2.946* 1.065 teaching Girls Rural Urban 230 Area *Significant Table 6: Student-wise analysis regarding achievement scores Category Gender Boys Sample Mean SD 179 42.5 91 52.6 40 40.6 230 46.8 ‘t’ value 6.02* From table 4, 13.4 12.9 12.8 12.9 Girls Rural Urban To test the hypothesis, t-test is applied and shows that the difference in these two means is not significant at 5% LOS. Hence the null hypothesis is accepted i.e., we concluded that the difference in the scores of students taught by male and female teachers is only sampling fluctuations and is not indicative of any true difference. The calculated t-value is 0.210 is far less than table value at 5% LOS and it may be concluded that the observed difference in these scores of rural and urban teachers is only due to sampling fluctuations. From the table (2.6) it can be seen that the mean achievement scores of students taught by PG teachers is higher than that of the students taught by non–PG teachers. The calculated t- value is 2.06 is less than the critical value, the null hypothesis is not accepted. Therefore it is concluded that the PG teachers were capable of producing significantly better results than non-PG teachers in terms of achievements. The above table shows that the mean of achievement scores of students taught by more experience teachers is higher than that of the students taught by less experience teachers. The calculated value is 2.1598 greater than table value (2.06) at 5% LOS. It is concluded that the difference in these means is indicative of bringing better results in terms of achievement among their students by more experienced teachers. The calculated t-value (1.657) is less than critical value at 5% LOS and it is concluded 2.82* Area *Significant CONCLUSIONS From the table 3, Itcan be seen that the mean teaching effectiveness scores of male teachers is 7.58 which is slightly greater than the mean score 7.04 of the female teachers but the calculated t-value 0.894 is less than the table value at 5% L.O.S with 25 df. Hence the hypothesis of no difference between male and female teachers is accepted, i.e., sex is not significantly influencing teaching effectiveness of math’s teachers. The mean teaching effectiveness scores of rural teachers (7.62) is slightly greater than mean scores of urban teachers (7.43). Since ‘t’ test reveals that there is no significant difference, the existing difference between mean scores is due to sampling fluctuations only and because of the true difference. The difference between PG and non-PG teachers in their teaching effectiveness is not significant i.e., qualification significantly influence effectiveness of mathematics teachers. The mean score of more experience teachers is greater than the less experienced teachers. Also, by testing it is concluded that the is teacher’s not the 315 IJTSRD | May-Jun 2017 Available Online @www.ijtsrd.com
International Journal of Trend in Scientific Research and Development, Volume 1(4), ISSN: 2456-6470 www.ijtsrd.com that the observed difference in the scores of students taught by 2 groups of teachers is only due to sampling fluctuations. From the above table it can be seen that the achievement scores of students taught by teachers who felt with problem of syllabus is higher than that of students taught by the teachers, who did not feel with the problem of syllabus. ‘t’ calculated value (0.796) is less than critical value at 5% LOS, therefore the null hypothesis is accepted. (6.02) is greater than the critical value at 5% los, the hypothesis is rejected. From the table 6, it shows that the mean achievement scores of urban students is higher than the rural students. The calculated t-value is greater than the t-critical value at 5% LOS and the null hypothesis is not accepted. Hence the urban students would significantly score better marks than rural students and this is most probably due to their better environment and exposal. From Table 5 and 6 REFERENCES The entire group of 270 students classified in to two groups, which comprised of179 boys and 91 girls the rating of the teachers by boys and girls is recorded and mean and S.D’s scores are represented in the table 5. The calculated t-value (0.786) is for the less than the critical value at 5% LOS and therefore the null hypothesis is accepted, i.e., that gender rating is not significant regarding the teaching effectiveness of mathematics teachers. From the table 5, shows that the mean ratings of teachers given by rural students is greater than the urban students (7.50) but the calculated t-value is (2.946) is greater than (2.06) at 5% LOS and therefore the null hypothesis is not acceptable. From the table 6, it shows that the mean achievement scores of girls is higher than the achievement scores of boys. The t-calculated [1]POSITION PAPER NATIONAL FOCUS GROUP ON MATHEMATICS, Educational Research and Training, New Delhi. [2]Olive Chapman ‘Understanding elementary school teachers of mathematics’, Journal of Mathematics Teacher Education, 2017 [3]Anne Garrison Wilhelm, Teachers' Enactment Demanding Tasks: Investigating Links to Teachers' Knowledge Journal for Research Education, 2014. 1.Agarwal, S, ‘Correlation study of Teacher Effectiveness and Job Satisfaction of Higher Secondary School Teachers’ Eductracks 2012. TEACHING National OF of Council ‘Mathematics Cognitively of and Conceptions’, Mathematics in 316 IJTSRD | May-Jun 2017 Available Online @www.ijtsrd.com