Download
1 / 12
120 likes | 256 Views
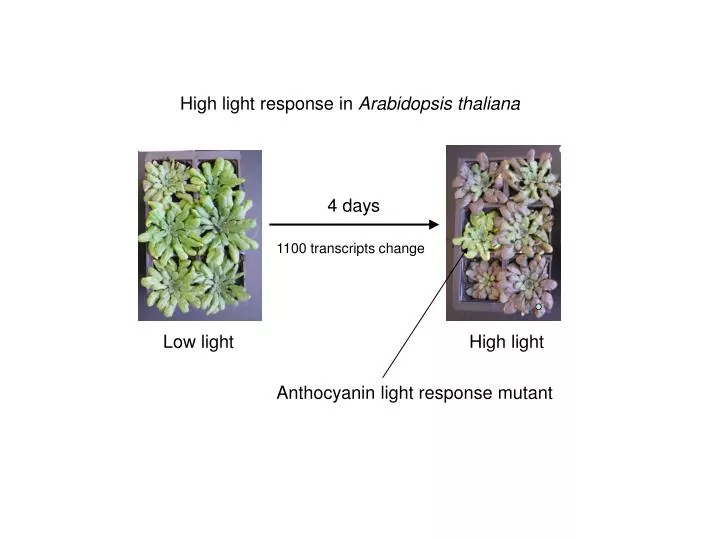
High light response in Arabidopsis thaliana. 4 days. 1100 transcripts change. Low light. High light. Anthocyanin light response mutant. Mutant characterisation by metabolite profiling. Targeted analysis of anthocyanins and other flavonoids (MRM). What else is different?

E N D
High light response in Arabidopsis thaliana 4 days 1100 transcripts change Low light High light Anthocyanin light response mutant
Mutant characterisation by metabolite profiling • Targeted analysis of anthocyanins and other flavonoids (MRM). • What else is different? • Run samples (wild type v. mutant HL v. LL) on LC-QToF. • Identify potential compounds in each sample using molecular feature extraction (MFE) in MassHunter: ~3000 “compounds”. • Align features (mass/retention time pairs) across samples (Perera-Yang method). • Statistical analysis to identify differentially expressed features. • Check MFE data to confirm. • Identify features from accurate mass/isotope abundance and MS/MS spectra. • Use m/z, retention time and MS/MS data to set up specific assays by MRM using QQQ.
Total ion chromatograms of 4 samples Extracted ion chromatograms (EIC) from one sample
Molecular feature extraction- identifies “compounds” by amalgamating charge states and adducts with the same chromatographic retention time.
Extracted compoundsaligned across samples and compared. Hierarchical clustering compares abundance of compounds in mutant and WT plants grown in low and high light
Extracted compoundsaligned across samples and compared. Hierarchical clustering compares abundance of compounds in mutant and WT plants grown in low and high light
Protein abundance – VTC2 MLKIKRVPTVVSNYQKDDGAEDPVGCGRNCLGACCLNGARLPLYACKNLVKSGEKLVISHEAIEPPVAFLESLVLGEWEDRFQRGLFRYDVTACETKVIPGKYGFVAQLNEGRHLKKRPTEFRVDKVLQSFDGSKFNFTKVGQEELLFQFEAGEDAQVQFFPCMPIDPENSPSVVAINVSPIEYGHVLLIPRVLDCLPQRIDHKSLLLAVHMAAEAANPYFRLGYNSLGAFATINHLHFQAYYLAMPFPLEKAPTKKITTTVSGVKISELLSYPVRSLLFEGGSSMQELSDTVSDCCVCLQNNNIPFNILISDCGRQIFLMPQCYAEKQALGEVSPEVLETQVNPAVWEISGHMVLKRKEDYEGASEDNAWRLLAEASLSEERFKEVTALAFEAIGCSNQEEDLEGTIVHQQNSSGNVNQKSNRTHGGPITNGTAAECLVLQ* precursor ion counts product ions acquisition time (mins)
6x His Protein abundance – VTC2 in vitro translation with labelled amino acid (e.g. 13C-Leu*) Detect mass difference between labelled and unlabelled protein * precursor ions * * * TRYPSIN * * * * * detect by mass spectrometry * FRAGMENTATION * * * * product ions • Spike plant extracts with a known quantity of labelled VTC2 • Directly compare abundance with VTC2 present in leaf extract • Spike plant extracts with multiple biosynthetic proteins – simultaneous quantification