Download
1 / 12
120 likes | 212 Views
Cross-Tabulations. We have been looking at these for some time already. An arrangement of two categorical variables into rows and columns. Row variable Column variable Tells about relationships between two categorical variables. Depression and a new baby, Fathers. | depress

E N D
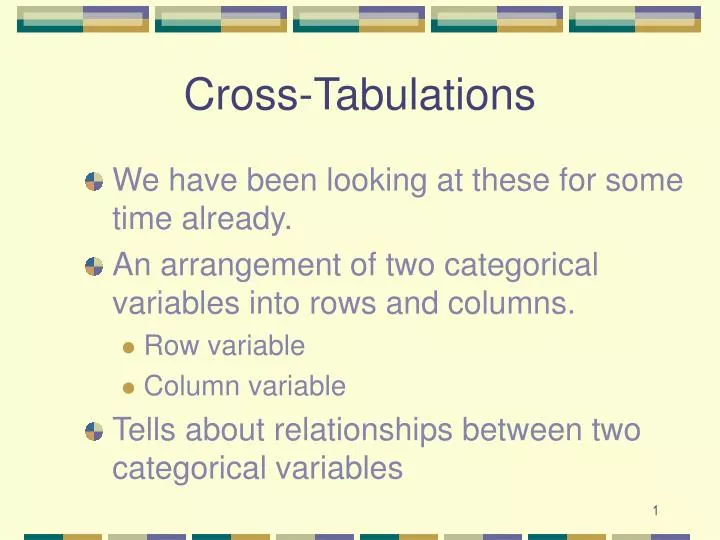
Cross-Tabulations • We have been looking at these for some time already. • An arrangement of two categorical variables into rows and columns. • Row variable • Column variable • Tells about relationships between two categorical variables
Depression and a new baby, Fathers | depress baby | 0 1 | Total -----------+----------------------+---------- 0 | 92 59 | 151 | 60.93 39.07 | 100.00 | 75.41 71.95 | 74.02 -----------+----------------------+---------- 1 | 30 23 | 53 | 56.60 43.40 | 100.00 | 24.59 28.05 | 25.98 -----------+----------------------+---------- Total | 122 82 | 204 | 59.80 40.20 | 100.00 | 100.00 100.00 | 100.00
Stress and social class | class stress | Low Middle Upper | Total -----------+---------------------------------+---------- Low | 246 90 55 | 391 | 62.92 23.02 14.07 | 100.00 | 59.42 64.75 80.88 | 62.96 -----------+---------------------------------+---------- High | 168 49 13 | 230 | 73.04 21.30 5.65 | 100.00 | 40.58 35.25 19.12 | 37.04 -----------+---------------------------------+---------- Total | 414 139 68 | 621 | 66.67 22.38 10.95 | 100.00 | 100.00 100.00 100.00 | 100.00
What goes into the cells? • Frequencies • Cell • Margin • Total • Row percentages • Column percentages • Total percentages
Percentages • Independent variable - suspected cause • Dependent variable - suspected effect • Percentages should be based on the independent or causal variable
Stress and social class | class stress | Low Middle Upper | Total -----------+---------------------------------+---------- Low | 246 90 55 | 391 | 62.92 23.02 14.07 | 100.00 | 59.42 64.75 80.88 | 62.96 -----------+---------------------------------+---------- High | 168 49 13 | 230 | 73.04 21.30 5.65 | 100.00 | 40.58 35.25 19.12 | 37.04 -----------+---------------------------------+---------- Total | 414 139 68 | 621 | 66.67 22.38 10.95 | 100.00 | 100.00 100.00 100.00 | 100.00
Make comparisons • Compare categories of the independent variable • To see effect on proportion in one category of the dependent variable • To make comparisons we must be sure the comparisons make sense -- are of the same thing: not apples with oranges!
Independence • Two variables, A and B, are independent if p(A) = p(A|B) • p(Stress) = .37, p(Stress|Hi class) = .19 • Also, note • p(s|low) = .41 p(s|mid) = .35 p(s|hi) = .19 • Also note, these are from the appropriate percentages, since class causes stress.
Independence • If there is independence, then • p(s) = p(s|lo) = p(s|mid) = p(s|hi) • What would the frequencies be if there was independence? • p(s) = .37 = p(s|lo) = p(s|mid) = p(s|hi) • This .37 is taken from the margin (unconditional probability of stress)
Apply this | class stress | Low Middle Upper | Total -----------+---------------------------------+---------- Low | 246 90 55 | 391 | 62.96 62.96 62.96 | 62.96 | 260.65 87.52 42.81 | -----------+---------------------------------+---------- High | 168 49 13 | 230 | 37.04 37.04 37.04 | 37.04 | 153.35 51.48 25.19 | -----------+---------------------------------+---------- Total | 414 139 68 | 621 | 100.00 100.00 100.00 | 100.00
Observed and Expected • Are they the same? • Then p(s) = p(s|class) -- Independence • Are they different? • Then p(s) ‡ p(s|class) -- Relationship • How can we tell?
Look at parts of formula What if we just sum difference without squaring? How big is a difference of 5 points? What happens when there are lots of cells in the table we are looking at?