Download
1 / 42
420 likes | 496 Views
What is Economics?. SWBAT: Explain why limited productive resources and unlimited wants results in scarcity, opportunity costs, and tradeoffs for individuals, businesses, and governments. SSEF1-2. What is Economics?.

E N D
What is Economics? SWBAT: Explain why limited productive resources and unlimited wants results in scarcity, opportunity costs, and tradeoffs for individuals, businesses, and governments. SSEF1-2
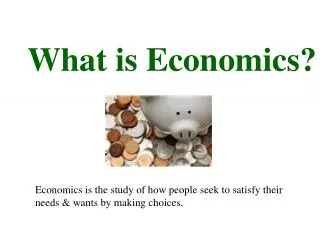
What is Economics? • Economics is the study of how people seek to satisfy their needs and wants by making choices.
Scarcity and Choice, Section 1 • A “need” is something that is necessary for survival (food, air, shelter) • A “want” is something we desire that is notessential to survival.
Goods vs. Services • Goods are physical objects such as shoes and shirts. • Services are actions or activities that one person performs for another.
Scarcity • Scarcity implies limited quantities of resources to meet unlimited wants. • Economics attempts to solve the problem of scarcity.
What type of scarcity does this political cartoon represent?
Shortage vs. Scarcity • A “shortage occurs” when producers will not or cannot offer goods or services. • Shortages can be temporary or long term. • “Scarcity” always exists because our needs and wants are always greater than our resource supply.
What resources were used to produce the fruits and vegetables shown here?
Factors of Production • Economists call the resources that are used to make all goods and services the factors of production. • Factors of production: land, labor, and capital (two types: human and physical).
Factors of Production (cont.) • Land refers to all natural resources used to produce goods and services. • Labor is the effort that a person devotes to a task for which that person is paid. • Capital is any human-made resource that is used to produce other goods and services.
Capital • Physical capital includes buildings, machinery, tools, etc. • Human capital is the knowledge and skills a worker gains through education and experience. • It assists in saving time and money when producing goods.
Closing Thought • All goods and services are scarce because the land, labor, and capital used to create them are scarce.
Can you identify the physical capital and human capital in this cartoon?
Journey of the French Fry… • Journey of the French Fry…. • Started as a potato; planted in soil, had to be watered, fertilized, harvested, processed, frozen, transported to a supermarket. • Cooked, sprinkled with salt, and eaten.
Scarce resources used to make the French Fry… • Land: Small quantity of land for agriculture • Labor: Limited amount of people available to plant, harvest, and process the potato crops. • Physical Capital: farming equipment
Making Choices…EFFICIENTLY SWBAT: (SSEF2) Give examples of how rational decision-making entails comparing the marginal benefits and the marginal costs of an action.
Think about it… Fred is a businessman - he sells snack foods to students at Mays. He is only able to sell a maximum of 21 bags (per class period) of Flaming Hots or 15 Capri Sun drinks (per class period). He has found that the best combination of sales are: 15 Capri Suns (CS) and 0 Flaming Hots (FH); 8 FH and 14 CS; 14 FH and 12 CS; 18 FH and 9 CS; 20 FH and 5 CS; 21 FH and 0 CS. However, his cousin suggested he try to sale 10 bags of Flaming Hots and 12 Capri Suns. Would following his cousin’s advice be the most productive?
Trade Offs • Trade Offs are all the alternatives that we give up whenever we choose one course of action over another.
Types of Trade-Offs • Individual Trade Offs • Businesses Trade Offs • Society Trade Offs: “Guns or Butter” • Should we produce more military goods (“guns”) or more consumer goods (“butter”)?
Opportunity Costs • The most desirable alternative given up as the result of a decision is called the opportunity cost.
????? If you choose to use your savings to pay off a credit card bill instead of going on the senior trip, what is your opportunity cost?
Marginal Costs vs. Marginal Benefits • The additional cost incurred from one more unit • The additional benefit gained from one more unit
Thinking at the Margin • When you’re trying to decide, “how much more, or how much less?”…you are thinking at the margin Rational Decisions are made when the marginal benefits equal or exceed marginal costs
Cost/Benefit Analysis Practice • Fred has decided to increase his supply of Capri Suns. It will cost Fred $75 to purchase an additional case of drinks. Once sold, this will result in $100 of additional revenue. Did Fred make a rational decision?
Productions Possibilities Curve (PPC) • Graphical representation of how an economy makes decisions • Shows the choices an economy can make with respect to its availableresources
Interpreting the PPC • All points on the curve represent the efficient production of goods and services (you are using your resources well) • Any point inside the curve represents an underutilization of resources (you’re wasting resources – could be producing more)
Help Fred make the most efficient decision… Fred is a businessman - he sells snack foods to students at Mays. He is only able to sell a maximum of 21 bags (per class period) of Flaming Hots or 15 Capri Sun drinks (per class period). He has found that the best combination of sales are: 15 Capri Suns (CS) and 0 Flaming Hots (FH); 8 FH and 14 CS; 14 FH and 12 CS; 18 FH and 9 CS; 20 FH and 5 CS; 21 FH and 0 CS. However, his cousin suggested he try to sale 10 bags of Flaming Hots and 12 Capri Suns. Would following his cousin’s advice be the most productive?
Rational and Productive Decision-Making Revisited SWBAT: (SSEF2) Give examples of how rational decision-making entails comparing the marginal benefits and the marginal costs of an action.
Marginal Cost/Benefit • The additional costs or benefits associated with a decision
Rational Decisions • Rational decisions are made when the marginal benefit of a decision meets or exceeds the marginal cost of that decision
Why are PPCs/PPFs valuable to decision-makers? • Graphical illustration of opportunity cost to produce more or one good (or service) • Shows how efficient (or inefficient) an economy is working • Shows growth or reduction
Interpreting the PPC/PPF • Points on the curve – efficient combination of goods/services • Points inside (under) the curve – inefficient use of resources • Points outside the curve – unattainable points (current productive resources will not allow the economy to produce
Why would the PPC/PPF move? • When the quantity or quality of land, labor, capital, or technology grows, the ENTIRE PPC will shift to the right • When the quantity or quality of land, labor, and capital shrinks, the ENTIRE PPC will shift to the left
Think about it… Refer back to our example of Fred selling Flaming Hots and Capri Suns. What circumstances would cause his PPC/PPF to shift to the right? What circumstances would cause his PPC/PPF to shift to the left?
Opportunity Costs and the PPC/PPF • The PPC/PPF is a graphical illustration of the opportunity cost involved in producing more of one good (or service)
Increasing Opportunity Cost • A convex curve always indicates increasing opportunity cost. • The opportunity cost of an additional storage shed (8 to 9) is 70 crab puffs. • Storage shed production results in increasing opportunity costs.
Constant Opportunity Cost • The opportunity cost of additional sheds does not change. Each additional unit costs the same amount of crab puffs. • The opportunity cost of more butter also remains constant.
Decreasing Opportunity Cost • When the curve is concave, there are decreasing opportunity costs. • The opportunity cost of the first the storage shed is 250 crab puffs; the ninth shed is only 15.