Download
1 / 1
10 likes | 121 Views
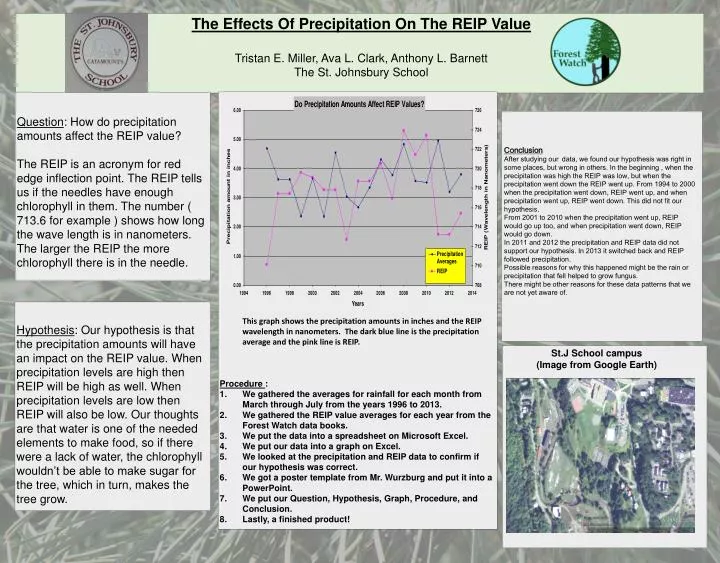
The Effects Of Precipitation On The REIP Value Tristan E. Miller, Ava L. Clark, Anthony L. Barnett The St. Johnsbury School. This graph shows the precipitation amounts in inches and the REIP wavelength in nanometers. The dark blue line is the precipitation average and the pink line is REIP.

E N D
The Effects Of Precipitation On The REIP Value Tristan E. Miller, Ava L. Clark, Anthony L. Barnett The St. Johnsbury School • This graph shows the precipitation amounts in inches and the REIP wavelength in nanometers. The dark blue line is the precipitation average and the pink line is REIP. • Procedure : • We gathered the averages for rainfall for each month from March through July from the years 1996 to 2013. • We gathered the REIP value averages for each year from the Forest Watch data books. • We put the data into a spreadsheet on Microsoft Excel. • We put our data into a graph on Excel. • We looked at the precipitation and REIP data to confirm if our hypothesis was correct. • We got a poster template from Mr. Wurzburg and put it into a PowerPoint. • We put our Question, Hypothesis, Graph, Procedure, and Conclusion. • Lastly, a finished product! Question: How do precipitation amounts affect the REIP value? The REIP is an acronym for red edge inflection point. The REIP tells us if the needles have enough chlorophyll in them. The number ( 713.6 for example ) shows how long the wave length is in nanometers. The larger the REIP the more chlorophyll there is in the needle. Conclusion After studying our data, we found our hypothesis was right in some places, but wrong in others. In the beginning , when the precipitation was high the REIP was low, but when the precipitation went down the REIP went up. From 1994 to 2000 when the precipitation went down, REIP went up, and when precipitation went up, REIP went down. This did not fit our hypothesis. From 2001 to 2010 when the precipitation went up, REIP would go up too, and when precipitation went down, REIP would go down. In 2011 and 2012 the precipitation and REIP data did not support our hypothesis. In 2013 it switched back and REIP followed precipitation. Possible reasons for why this happened might be the rain or precipitation that fell helped to grow fungus. There might be other reasons for these data patterns that we are not yet aware of. Hypothesis: Our hypothesis is that the precipitation amounts will have an impact on the REIP value. When precipitation levels are high then REIP will be high as well. When precipitation levels are low then REIP will also be low. Our thoughts are that water is one of the needed elements to make food, so if there were a lack of water, the chlorophyll wouldn’t be able to make sugar for the tree, which in turn, makes the tree grow. St.J School campus (Image from Google Earth)