Download
1 / 1
20 likes | 135 Views
16th CROI 2009 February 8-12 Montreal, Canada. The Use of Pooled Viral Load Testing to Identify Antiretroviral Treatment Failure Davey Smith 1 , Susanne May 2 , Josué P erez-Santiago 1 , Matthew Strain 1 , Richard Haubrich 1 , Douglas Richman 1,3, , Constance Benson 1 , and Susan Little 1

E N D
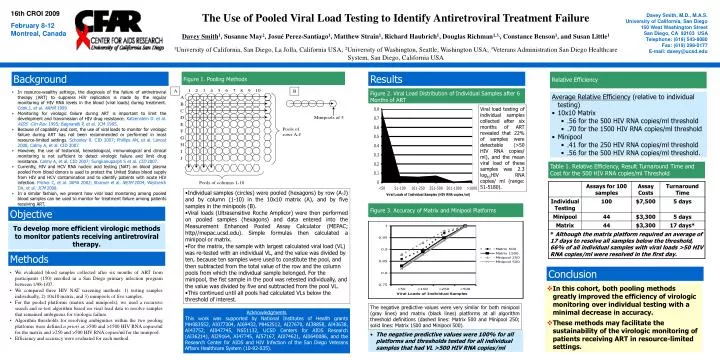
16th CROI 2009 February 8-12 Montreal, Canada The Use of Pooled Viral Load Testing to Identify Antiretroviral Treatment Failure Davey Smith1, Susanne May2, Josué Perez-Santiago1, Matthew Strain1, Richard Haubrich1, Douglas Richman1,3,, Constance Benson1, and Susan Little1 1University of California, San Diego, La Jolla, California USA; 2University of Washington, Seattle, Washington USA; 3Veterans Administration San Diego Healthcare System, San Diego, California USA Davey Smith, M.D., M.A.S. University of California, San Diego 150 West Washington Street San Diego, CA 92103 USA Telephone: (619) 543-8080 Fax: (619) 298-0177 E-mail: davey@ucsd.edu Background Figure 1. Pooling Methods Results Relative Efficiency • In resource-wealthy settings, the diagnosis of the failure of antiretroviral therapy (ART) to suppress HIV replication is made by the regular monitoring of HIV RNA levels in the blood (viral loads) during treatment. Cook.J, et al. ARHR 1999 • Monitoring for virologic failure during ART is important to limit the development and transmission of HIV drug resistance. Katzenstein D. et al. AIDS Clin Rev. 1995; Bagnarelli P, et al. JCM 1995. • Because of capability and cost, the use of viralloads to monitor for virologic failure during ART has not been recommended or performed in most resource-limited settings. Schooley R. CID 2007; Phillips AN, et al. Lancet 2008, Calmy A, et al. CID 2007. • However, the use of historical, hematological, immunological and clinical monitoring is not sufficient to detect virologic failure and limit drug resistance. Calmy A, et al. CID 2007; Sungkanuparph S et al. CID 2007. • Currently, HIV and HCV RNA nucleic acid testing (NAT) on blood plasma pooled from blood donors is used to protect the United States blood supply from HIV and HCV contamination and to identify patients with acute HIV infection. Pilcher C, et al. JAMA 2002; Stramer et al. NEJM 2004; Westreich DA, et al. JCM 2008. • In a similar fashion, we present how viral load monitoring among pooled blood samples can be used to monitor for treatment failure among patients receiving ART. Figure 2. Viral Load Distribution of Individual Samples after 6 Months of ART • Average Relative Efficiency (relative to individual testing) • 10x10 Matrix • .56 for the 500 HIV RNA copies/ml threshold • .70 for the 1500 HIV RNA copies/ml threshold • Minipool • .41 for the 250 HIV RNA copies/ml threshold • .56 for the 500 HIV RNA copies/ml threshold. Viral load testing of individual samples collected after six months of ART revealed that 22% of samples were detectable (>50 HIV RNA copies/ ml), and the mean viral load of these samples was 2.3 log10HIV RNA copies/ ml (range: 51-5180). Table 1. Relative Efficiency, Result Turnaround Time and Cost for the 500 HIV RNA copies/ml Threshold • Individual samples (circles) were pooled (hexagons) by row (A-J) and by column (1-10) in the 10x10 matrix (A), and by five samples in the minipools (B). • Viral loads (Ultrasensitive Roche Amplicor) were then performed on pooled samples (hexagons) and data entered into the Measurement Enhanced Pooled Assay Calculator (MEPAC; http//mepac.ucsd.edu). Simple formulas then calculated a minipool or matrix. • For the matrix, the sample with largest calculated viral load (VL) was re-tested with an individual VL, and the value was divided by ten, because ten samples were used to constitute the pool, and then subtracted from the total value of the row and the column pools from which the individual sample belonged. For the minipool, the fist sample in the pool was retested individually, and the value was divided by five and subtracted from the pool VL. • This continued until all pools had calculated VLs below the threshold of interest. Figure 3. Accuracy of Matrix and Minipool Platforms Objective To develop more efficient virologic methods to monitor patients receiving antiretroviral therapy. Methods Conclusion • We evaluated blood samples collected after six months of ART from participants (150) enrolled in a San Diego primary infection program between 1/98-1/07. • We compared three HIV NAT screening methods: 1) testing samples individually, 2) 10x10 matrix, and 3) minipools of five samples. • For the pooled platforms (matrix and minipools), we used a recursive search and re-test algorithm based on viral load data to resolve samples that remained ambiguous for virologic failure. • Algorithm thresholds for resolving ambiguities within the two pooling platforms were defined a priori as >500 and >1500 HIV RNA copies/ml for the matrix and >250 and >500 HIV RNA copies/ml for the minipool. • Efficiency and accuracy were evaluated for each method. • In this cohort, both pooling methods greatly improved the efficiency of virologic monitoring over individual testing with a minimal decrease in accuracy. • These methods may facilitate the sustainability of the virologic monitoring of patients receiving ART in resource-limited settings. The negative predictive values were very similar for both minipool (gray lines) and matrix (black lines) platforms at all algorithm threshold definitions (dashed lines: Matrix 500 and Minipool 250; solid lines: Matrix 1500 and Minipool 500). Acknowledgments This work was supported by National Institutes of Health grants MH083552, AI077304, AI69432, MH62512, AI27670, AI38858, AI43638, AI43752, AI047745, NS51132, UCSD Centers for AIDS Research (AI36214), AI29164, AI47745, AI57167,AI074621, AI0640086,and the Research Center for AIDS and HIV Infection of the San Diego Veterans Affairs Healthcare System (10-92-035). • The negative predictive values were 100% for all platforms and thresholds tested for all individual samples that had VL >500 HIV RNA copies/ml