Download
1 / 33
330 likes | 450 Views
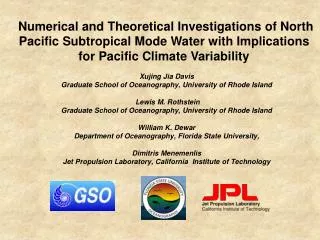
Numerical and Theoretical Investigations of North Pacific Subtropical Mode Water with Implications to Pacific Climate Variability. Xujing Jia Davis Graduate School of Oceanography, University of Rhode Island Lewis M. Rothstein Graduate School of Oceanography, University of Rhode Island

E N D
Numerical and Theoretical Investigations of North Pacific Subtropical Mode Water with Implications to Pacific Climate Variability Xujing Jia Davis Graduate School of Oceanography, University of Rhode Island Lewis M. Rothstein Graduate School of Oceanography, University of Rhode Island William K. Dewar Department of Oceanography, Florida State University, Dimitris Menemenlis Jet Propulsion Laboratory, California Institute of Technology
North Pacific Subtropical Mode Water (STMW) Schematic current patterns in western North Pacific Location: forms and resides south of Kuroshio Extension (KE) Features: -weakly stratified, low PV -upper 500 m of the ocean water column -inhabits thermostads between 16 and 19C STMW formation region -salinity range of 34.65-34.8psu -potential density values of 24.8-25.7 kg/m^3 (Masuzawa, 1969; Suga et al., 1990; Eitarou et al., 2004)
Questions • STMW has known seasonal variability, but what is the variability of STMW on longer time scales? • What is the relationship (if any) between low frequency STMW and established climate patterns in the Pacific? • Dynamics behind it?
Model and Simulation Descriptions MITgcm : 3D, z level, primitive equation OGCM (Marshall, 1997) • ECCO2 (Cube 37) global-ocean and sea-ice simulation : -28-year spin-up prior to its initial January 1992 conditions, carried out by cycling through the 1992-2000 NCEP forcing converted to fluxes using model SST and the Large and Pond bulk formulae (Large et al, 1995,Menemenlis, 2005) • , S, u, v • - Resolution: horizontal resolution: 1/6 lat x 1/6 lon; vertically, from surface to ~6km, 10 m resolution above 100 m and stretched to 95 m around 1000 m - temporal coverage: 1992, Jan – 2006 Mar (171 months) -Output hasn’t been constrained by oceanic and seaice data yet
STMW definition Definition in Cube37 simulation - PV is less or equal to - potential density between 24.5~25.3 kg/m^3 - region of 130E~ 200E, 20N~ 40N and east of islands of Japan Defined STMW region
Compare with Observation MITgcm, May 2004 KESS, late May 2004 After Rainville,et al., 2007
Temporal variability: 3-D averaged features of STMW 1999/2000 During 1999/2000, cooler, fresher, lower PV, lighter, thinner, shallower STMW
Temporal variability: STMW volume 1999/2000
Dominant signal for the STMW variability Power spectrum of STMW Volume 1 year 7 year Power (m^6/cpm) 0.5 year 99% confidence level Frequency (cycles/month) Annual cycle is the most significant
Seasonality of STMW in climatological fields in MITgcm Take as an example: Where is the calculated climatological field
Seasonality in climatological fields-meridional cross section
Seasonality in climatological fields-meridional cross section
Seasonality in climatological fields-meridional cross section
Seasonality in climatological fields-meridional cross section
Results: Seasonality in climatological fields-meridional cross section
Seasonality in climatological fields-meridional cross section
Results: Seasonality in climatological fields-threetime periods Period I Period II Period III Formation Isolation Dissipation Period I: STMW formation (Nov~Mar) Period II: STMW isolation (Mar~Jun) Period III: STMW dissipation (Jun~Nov)
STMW variability and its relation to Pacific climate variation
The Pacific Decadal Oscillation (PDO) SST Warm phase: cooler SST in STMW region Cool Phase: warmer SST in STMW region warm phase cool phase cool phase 1976/77 1998/99 cool phase warm phase www.jisao.washington.edu/pdo/
STMW Variability & PDO 1998/1999 STMW variability is highly correlated with PDO index Co=0.69, significant value=0.1 with 95% level of confidence Warm phase of PDO Cool phase of PDO Warm phase of PDO Cool phase of PDO
Connection between STMW & PDO:large scale atmospheric variations
PDO Index The 1st EOF time coefficient of the SST north of 20 N in Pacific
Connection between STMW & PDO:large scale atmospheric variations , 1st EOF (37.7%) , 1st EOF (37.7%) Less heat loss Stronger Ekman pumping Year 1996, STMW maximum Year 1999, STMWminimum
Summary (MITgcm) • The dominant temporal pattern of STMW is seasonality, the annual cycle can be divided into formation, isolation and dissipation periods that correspond to distinct stages of STMW evolution • An interannual signal is clearly seen in STMW variability as well, this lower frequency signal shows significant correlation with PDO index • This likely results from the variations in the large scale atmospheric forcing: wind stress and air-sea heat flux
Theoretical frameworks and possible mechanisms of STMW variability • Following Dewar et al 2005, a modified LPS framework may be established to describe STMW and its connections to large scale ocean-atmospheric circulation • A PGOM (Samelson & Vallis, 1997) numerically approximates the solutions to this framework and describes STMW characteristics. • PGOM experiments demonstrate that the interannual variability observed in the Cube 37 simulations can be driven by variations in the large scale air-sea heat flux and wind stress patterns seen in the NCEP reanalysis.
Acknowledgements • Lewis Rothstein (URI) • William Dewar (FSU) • Dimitris Menemenlis (JPL) • Roger Samelson (OSU) • Geoffrey Vallis (GFDL) • Young-Oh Kwon (WHOI)
Seasonality in climatological fields-meridional cross section
Summary (PGOM) • PGOM representation of the modified LPS framework produces a distinct analog to STMW • Within this model/framework, Ekman pumping is necessary for the existence and maintenance of STMW • Quasi-realistic time varying atmospheric forcing experiments show variable large scale wind stress (Ekman pumping) and air sea heat fluxes can separately generate seasonal and interannual variability in STMW