Download
1 / 1
10 likes | 106 Views
Nonlinear Dependence of Global Warming Prediction on Ocean State. Mao-Chang Liang 1 , Li-Ching Lin 1 , Ka-Kit Tung 2 , Yuk L. Yung 3 , Shan Sun 4 1 Research Center for Environmental Changes, Academia Sinica, Taipei, Taiwan 2 Department of Applied Mathematics, University of Washington, USA

E N D
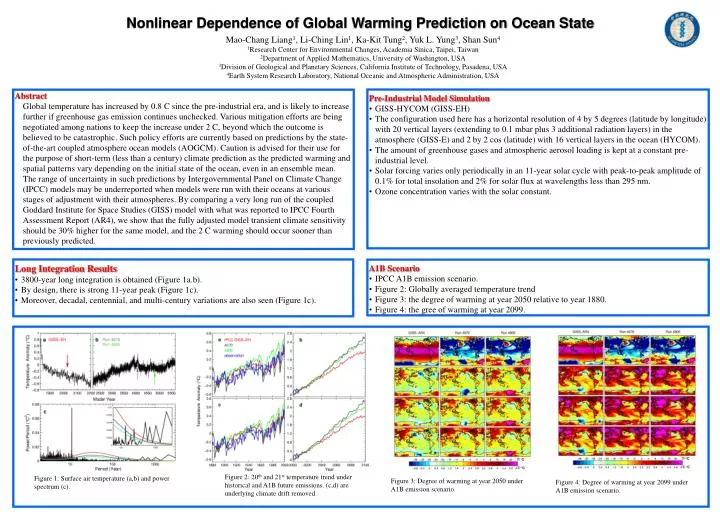
Nonlinear Dependence of Global Warming Prediction on Ocean State Mao-Chang Liang1, Li-Ching Lin1, Ka-Kit Tung2, Yuk L. Yung3, Shan Sun4 1Research Center for Environmental Changes, Academia Sinica, Taipei, Taiwan 2Department of Applied Mathematics, University of Washington, USA 3Division of Geological and Planetary Sciences, California Institute of Technology, Pasadena, USA 4Earth System Research Laboratory, National Oceanic and Atmospheric Administration, USA • Pre-Industrial Model Simulation • GISS-HYCOM (GISS-EH) • The configuration used here has a horizontal resolution of 4 by 5 degrees (latitude by longitude) with 20 vertical layers (extending to 0.1 mbar plus 3 additional radiation layers) in the atmosphere (GISS-E) and 2 by 2 cos (latitude) with 16 vertical layers in the ocean (HYCOM). • The amount of greenhouse gases and atmospheric aerosol loading is kept at a constant pre-industrial level. • Solar forcing varies only periodically in an 11-year solar cycle with peak-to-peak amplitude of 0.1% for total insolation and 2% for solar flux at wavelengths less than 295 nm. • Ozone concentration varies with the solar constant. • Abstract • Global temperature has increased by 0.8 C since the pre-industrial era, and is likely to increase further if greenhouse gas emission continues unchecked. Various mitigation efforts are being negotiated among nations to keep the increase under 2 C, beyond which the outcome is believed to be catastrophic. Such policy efforts are currently based on predictions by the state-of-the-art coupled atmosphere ocean models (AOGCM). Caution is advised for their use for the purpose of short-term (less than a century) climate prediction as the predicted warming and spatial patterns vary depending on the initial state of the ocean, even in an ensemble mean. The range of uncertainty in such predictions by Intergovernmental Panel on Climate Change (IPCC) models may be underreported when models were run with their oceans at various stages of adjustment with their atmospheres. By comparing a very long run of the coupled Goddard Institute for Space Studies (GISS) model with what was reported to IPCC Fourth Assessment Report (AR4), we show that the fully adjusted model transient climate sensitivity should be 30% higher for the same model, and the 2 C warming should occur sooner than previously predicted. • Long Integration Results • 3800-year long integration is obtained (Figure 1a.b). • By design, there is strong 11-year peak (Figure 1c). • Moreover, decadal, centennial, and multi-century variations are also seen (Figure 1c). • A1B Scenario • IPCC A1B emission scenario. • Figure 2: Globally averaged temperature trend • Figure 3: the degree of warming at year 2050 relative to year 1880. • Figure 4: the gree of warming at year 2099. Figure 2: 20th and 21st temperature trend under historical and A1B future emissions. (c,d) are underlying climate drift removed. Figure 1: Surface air temperature (a,b) and power spectrum (c). Figure 3: Degree of warming at year 2050 under A1B emission scenario. Figure 4: Degree of warming at year 2099 under A1B emission scenario.