Download

1 / 9
90 likes | 740 Views
Applications of Venn Diagrams. Section 2.2. De Morgan’s Laws. For any sets A and B, then (A U B)’ = A’ ∩ B’ The compliment of the union is the intersection of each compliment. (A ∩ B)’ = A’ U B’ The compliment of the intersection is the union of each compliment.

E N D
Applications of Venn Diagrams Section 2.2
De Morgan’s Laws • For any sets A and B, then (A U B)’ = A’ ∩ B’ The compliment of the union is the intersection of each compliment. (A ∩ B)’ = A’ U B’ The compliment of the intersection is the union of each compliment.
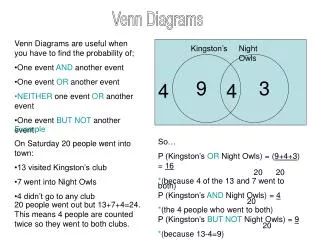
Solving the Cardinal Number Problem • Define a set for each category in the universal set. • Draw a Venn diagram with as many overlapping circles as the number of sets you have defined. • Write down all the given cardinal numbers corresponding to various given sets. • Starting with the innermost overlap, fill in each region of the Venn diagram with its cardinal number.
Example 1 • A survey of 300 workers yielded the following information: 231 belonged to the Teamsters Union, and 195 were Democrats. If 172 of the Teamsters were Democrats, how many workers were in the following situations? • Belonged to the Teamsters or were Democrats • Belonged to the Teamsters but were not Democrats • Were Democrats but did not belong to the Teamsters • Neither belonged to the Teamsters nor were Democrats.
Explanation • Let us define T = The event that a worker belongs to the teamsters, and D = the event that a worker is a Democrat. Note that n(U) = 300. • We were given the fact that 172 workers were both in the Teamsters and a Democrat, that is n(T ∩ D)=172 • We are given that n(T)=231 and n(D)=195. • Thus n(T U D) = n(T) + n(D) – n(T ∩ D) n(T U D) = 231 +195 – 172 = 254. • Those who are only Democrats and do not belong to the Teamsters are n(D) – n(T ∩ D) = 195 – 172 = 23. • Those who are only Teamsters but not Democrats are n(T) – n(T ∩ D) = 231 – 172 = 59. • Those who are neither Teamster or Democrat fall outside of the circles. Use the complimentary law n(T U D) + n((T U D)’) = n(U). • n((T U D)’) = n(U) – n(T U D) = 300 – 254 =46.
Example 2 • Way back in 1965, The Beatles, The Kinks, and The Rolling Stones toured the USA. A large group of teenagers were surveyed and the following information was obtained: 825 saw The Kinks, 1033 saw The Beatles, 1247 saw The Rolling Stones, 211 saw all three, 514 saw none, 240 saw only The Rolling Stones, 677 saw The Rolling Stones and The Beatles, and 201 saw The Beatles and The Kinks but not The Rolling Stones. A. What percent of the teenagers saw at least one band? B. What percent of the teenagers saw exactly one band?
Explanation • Begin labeling the diagram with the innermost overlap. 211 saw all three. • Note also that the region outside of the circle contains 514. These are teens who saw no band. • Continue using the given info: 240 saw only the Rolling Stones. • 201 saw The Beatles and The Kinks but not The Rolling Stones. • 677 saw The Beatles and The Rolling Stones. Now that region already has 211 people in there. Take 677-211 and that will give 466 people who saw The Beatles and the Rolling Stones but not The Kinks. • Now we can find the people who only saw The Beatles. • Take 1033 and subtract (201+211+466). This gives 155 people who only saw The Beatles. • To find the number of people who saw The Rolling Stones and The Kinks but not the Beatles, take 1247 – (211+466+240)=330. • To find the number of people who only saw The Kinks 825 – (211+ 201+33) = 83. • The total number of people surveyed is 83+201+211+330+240+446+155+514=2200. • Now answer question A: The people who saw at least one band is (2200-514)/2200=76.6% • Question B: The people who saw only one band is (83+155+240)/2200=21.7%.