Download
1 / 20
200 likes | 367 Views
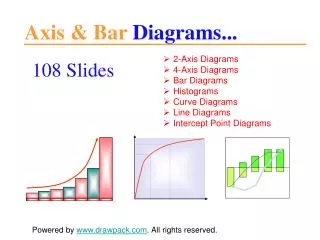
PowerPoint Graphics. Go through this show in PowerPoint by using the right scrollbar or clicking individual slide thumbnails on the left side. This show is about PowerPoint graphics tools, how they work, what they do, how to get to them.

E N D
PowerPoint Graphics Go through this show in PowerPoint by using the right scrollbar or clicking individual slide thumbnails on the left side. This show is about PowerPoint graphics tools, how they work, what they do, how to get to them. Try the techniques described in these slides and then go further. If you are new to PowerPoint do things more than once to increase your retention. You won’t be able to use this software to the potential it can be used until you know what it has to offer. Have fun and play with the tools.
adding a new slide When you click the New Slide button, this Slide Layout panel appears. My favorite choice is the empty layout. Read the yellow text box information. Then try the suggested actions. Click the New Slide button and select a layout.
PowerPoint Shapes are vector graphics. PowerPoint offers many basic shapes and symbols. Each has an outside line (sometimes called a stroke) and a fill. You can change the lines or fills or you can design your shapes so they do not have a line or a fill. PowerPoint shapes are vector graphics that can be filled with raster graphics.
After a shape is drawn on a slide, double clicking the shape will automatically activate the shape formatting tools shown above. Notice the paint bucket for Fill and the pencil for Outline options. Try these. Shape Effects are new in PowerPoint 2007 and 2010. Your designs can really take off with all these options. You can turn simple shapes into beautiful and unique graphics. Simple shapes can become building blocks for more complex graphics. Slides can have one or many shapes that can be arranged and stacked however you like.
Create a circle alongside this one. To keep it a perfect circle, select the Circle tool in the Shapes menu and hold the shift key while you draw. This works for squares too and works for almost all software that draws primitive shapes. Try making a square. Try a triangle – these are “primitives”. Then select each and go into the fill and line options to customize your primitive shapes. When you select a shape, the handles appear. You can grab the handles to resize the shape and when your cursor is 4 arrows, you can move the shape around. Watch the cursor as you move it around and over the handles, it will tell you what you can do.
Try selecting this shape so the handles appear. Make it smaller (called “scaling”), make it an oval. With the circle still selected, use the arrow keys on the keyboard to make it crawl around the screen for positioning. Notice when you click an arrow key the circle moves a certain distance. Sometimes the distance is more than you want. Hot tipHold the Ctrl key while clicking an arrow key. The movement distance is decreased.
With an object selected as shown in this screen picture, click the Paint Bucket tool for color and fill options. You may want More Fill Colors. This Colors window is an 8-bit palette with 256 colors. Click the Custom tab for the 24-bit color spectrum with about 16.7 million color options.
This Colors window is the 24-bit color spectrum with about 16.7 million color options. You can move the black triangle slider for color value changes and the white bulls-eye for hue and color intensity changes. Notice at the bottom of the window there is also a Transparency slider. The transparency setting is also called the “alpha channel” in other graphics editing software. Try all these options when composing your slides for Assignment 4.
You can also right click a shape and select Format Shape in the fly-out menu. This is another easy way to access all the options. Try right clicking this circle for the menu shown here. Discover the power in this menu with all the options you have for filling your objects with patterns, textures, gradients, even photos. Explore and understand these options so you can use them to improve the visual quality in your presentation graphics.
PowerPoint slides have foreground graphics and backgrounds. (Sometimes there are mid-ground graphics too.) The illusion of depth is created by design choices you make with foreground and background. Warm colors come forward, cool colors recede. Bright colors come forward, dull or dark colors recede. To change a slide background, right click anywhere in the empty area of the slide, not on any object. Select Format BackgroundThis menu will appear. Try changing the background of this slide to a gradient.
When you add a photo background, PowerPoint will scale the photo to fill the slide. If your slide is proportionally different than this screen (4:3 ratio), the photo will be scaled out of proportion. A picture background is not a selectable object on a slide and will always be behind every object you add to the slide. PowerPoint has very good “interpolation algorithms”. What does this mean?Interpolation is the computers ability to create new data or add data based on existing data. An algorithm is a built-in set of software instructions to accomplish a defined task, such as scaling a picture.
Try changing the background of this slide to a different photo. Notice how you can also right-click this background and “Save Background” which will create a graphics file on your computer.Do you know how I made this textbox semi-transparent to even out the background foreground contrast? The next slide is about ClipArt. There are both raster and vector clip art. To follow the Assignment instructions for slide 3 use vector clip art. In general, if it looks like an illustration and not a photo, it is vector. If it looks like a photo it is most likely raster.
This is the ClipArt button under the Insert tab. This opens a ClipArt Gallery. You type in key words to search the image database and get thumbnails of different art you can add to your slide by double-clicking the thumbnail. Try this button in your toolbar and add a vector clip art to this slide.
Guess what word was searched? Right click the monkey and select Group > Ungroup, from the fly out menu. A message will appear about converting it to a Microsoft drawing, select yes. Then do it again. Select Group > Ungroup again. Once ungrouped you can see how the monkey was built with basic shapes and fills. You are reverse engineering it. Someone got paid to make this monkey.
This is a raster graphic screen picture of the ungrouped vector graphic monkey. Each object in the vector graphic has four corner points and a green rotate point as shown in this picture. Slide 3 in the current assignment is where you compose a slide with ungrouped and adjusted clip art. Be sure to keep the originals on the slide. After being ungrouped twice, the monkey gets lots of handles because it now has many separate parts that you can change individually in all the ways you changed the circles and squares. (make the eyes red, make the ears huge…)
Try importing another ClipArt onto this slide and see if it will ungroup, not all art will. The simple illustration looking art will ungroup because most clip art is made of vector graphics. The greatest benefit to vector graphics are their unlimited scalability. Raster graphics (based on pixels) do not have this.
You can access the many tools for creating and manipulating graphics in PowerPoint by first getting the graphic on the slide, whether shapes or importing photos. Then double-click the graphic and PowerPoint will automatically switch menus and tools to the ones that apply to the graphic. Try double-clicking this graphic and notice how the top menu and toolbars change. Is this a raster or vector graphic? To copy a graphic, symbol, or text box on a slide so you have two or more, hold the Ctrl key while dragging the object. Try it, make a copy of this graphic with the Ctrl drag technique.
Select the graphic on this slide. Use your arrow keys and try to get the graphic to sit perfectly on the line with the bottom of the graphic just touching the line exactly. No luck? Try holding the Ctrl key with the arrows. Any better?
Do you have any pictures on your walls? Are any in frames? Frames will enhance a picture: the right frame, even simple frames. They separate a picture from the background adding a visual improvement. PowerPoint makes it so easy to add simple or complex frames. The frames will automatically adapt to changes you make in picture size and locations. Try double clicking this photo, add a frame from the preset frame styles. Try adding a frame using the Picture Border drop-down menu, choose a weight and a color. Check out the Picture Effects, these are new to PowerPoint 2007.
If you haven’t viewed the shows with past DM10 student work, you should. They are worth your time. Maybe I’ll add your slides for future DM10 students. Links are provided on the Assignment 4 webpage.