Download
1 / 31
320 likes | 572 Views
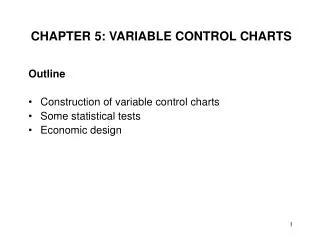
Chapter 5 Control Charts for Variables. กัญชลา สุดตาชาติ. Learning objective. มีความรู้ความเข้าใจหลักการทางสถิติพื้นฐานสำหรับ Control charts ชนิด Variable สามารถออกแบบ Control charts ชนิด Variable ได้ สามารถกำหนดค่าต่างๆ ของ และ R chart ได้

E N D
Chapter 5Control Charts for Variables กัญชลา สุดตาชาติ Control Charts for Variables
Learning objective • มีความรู้ความเข้าใจหลักการทางสถิติพื้นฐานสำหรับ Control charts ชนิด Variable • สามารถออกแบบ Control charts ชนิด Variable ได้ • สามารถกำหนดค่าต่างๆ ของ และ R chart ได้ • สามารถประมาณค่า process capability ของกระบวนการผลิตจากข้อมูลที่ได้จาก control chart ได้ • สามารถกำหนดค่าต่างๆ ของ และ s chart ได้ • สามารถกำหนดค่าต่างๆ ของ MR chart ได้ Control Charts for Variables
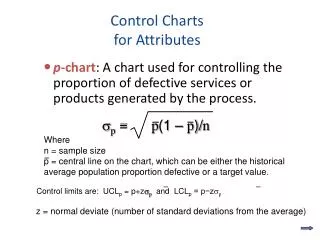
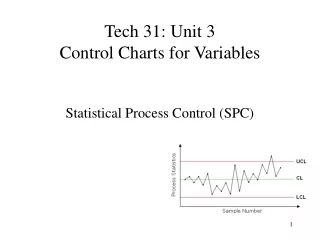
Introduction • ลักษณะทางคุณภาพที่สามารถแสดงในรูป numerical measurement ตัวอย่าง ค่า diameter ของ bearing , ความยาว, ความกว้าง, อุณหภูมิ, ปริมาตร เราเรียกว่า variable • ทั่วไปจำเป็นที่จะต้องมีการสังเกตค่าทั้งค่าเฉลี่ย และ ความแปรผันของลักษณะทางคุณภาพ • การควบคุมระดับค่าเฉลี่ยของกระบวนการ ใช้ control chart ที่เรียกว่า x bar chart • การควบคุมระดับความแปรผันของกระบวนการ ใช้ control chart ที่เรียกว่า R chart หรือ s chart • ความสำคัญ คือ ต้องควบคุมรักษาไว้ทั้ง ค่าเฉลี่ยกระบวนการและ ความแปรผันของกระบวนการ Control Charts for Variables
Introduction Control Charts for Variables
Control chart for x bar and R chart Control Charts for Variables
Control chart for x bar and R chart • ถ้าเรารู้ค่า สมการ 5-1 สามารถใช้เป็น upper และ lower control limit ซึ่งเราจะแทนค่า = 3 • ถ้าค่าเฉลี่ยอยู่นอกขอบเขตนี้ คือ สิ่งที่บ่งชี้ได้ว่า กระบวนการผลิตมีค่าเฉลี่ย ไม่เท่ากับค่า • ในการปฏิบัติเราไม่ทราบค่าของ ตามทฤษฎี ดังนั้นเราต้องประมาณค่าจากตัวอย่างขั้นตอน หรือ Subgroups โดยทั่วไปใช้อย่างน้อย 20 ถึง 25 กลุ่มตัวอย่าง • m คือ จำนวนกลุ่มตัวอย่างที่เราสุ่มมา • n คือ จำนวน observation (ค่าสังเกต) จากแต่ละกลุ่มตัวอย่าง โดยทั่วไป n จะมีขนาดเล็ก ใช้ค่า 4, 5 ,6 • เราจะคำนวณหาค่าเฉลี่ยของแต่ละกลุ่มตัวอย่าง () จากนั้นหาค่าเฉลี่ยรวมของทุกกลุ่ม (x) Control Charts for Variables
Subgroup Data with Unknown and Control Charts for Variables
Application of and R Charts • สมการ 5-4 และสมการ 5-5 ใช้สำหรับtrial control limits • กำหนดค่าของmซึ่งเป็นจำนวนกลุ่มตัวอย่าง samples ในขั้นต้น • ใช้ประมาณ 20-25 subgroups ขนาดของnอยู่ระหว่าง 3 และ 5 • ถ้าไม่มีจุดใดๆ out-of-control นำเอาผลที่ได้จาก trial control limits ไปใช้สำหรับควบคุมกระบวนการ Control Charts for Variables
Application of and R Charts • ถ้ามีจุดใดๆ out-of-control ควรที่จะตรวจสอบหา assignable causes • ถ้า assignable causes สามารถค้นหาพบ เราจะตัดจุดนั้นทิ้งจะไม่นำมาใช้คำนวณ และ revise ค่าของ trial control limits • ทำการตรวจสอบต่อเนื่องจนกระทั่งทุกจุด plot in control • นำเอาผลที่ได้จาก trial control limits ไปใช้สำหรับควบคุมกระบวนการ Control Charts for Variables
Application of and R Charts • ถ้า assignable cause ที่ทำให้เกิดการแปรผันของกระบวนการผลิต เราไม่สามารถหาสาเหตุได้ มีวิธีปฏิบัติอยู่ 2 วิธี • ขจัดจุดนั้นๆ ออกไป ซึ่งเป็นจุดที่เกิดจาก assignable cause และ revise limits • เก็บจุดนั้นไว้ และพิจารณาขอบเขตควบคุมที่เหมาะสมอของ control chart • ถ้ามีหลายๆ จุดซึ่ง out-of-control เราควรที่จะต้องตรวจสอบว่ารูปแบบของจุดมีลักษณะเป็นpatternsหรือไม่ ซึ่งอาจสามารถบ่งชี้ได้ว่ารูปแบบเฉพาะนี้เกิดจาก process problems Control Charts for Variables
Revise control limit Control Charts for Variables
Revise control limit Control Charts for Variables
การประมาณค่า process capability • x bar และ R chart ใช้เป็นข้อมูลสำหรับประมาณค่าพารามิเตอร์ของลักษณะคุณภาพ คือ and • x bar และ R chart ใช้เป็นข้อมูลสำหรับ performance of process(สมรรถนะของกระบวนการ) และ capability process • โดยเราสามารถคำนวณค่าของเปอร์เซ็นต์ nonconforming ที่เกิดขึ้นจากกระบวนการผลิต Control Charts for Variables
การประมาณค่า process capability • ค่าของ lower and upper natural tolerance limit UNTL = + 3 LNTL = - 3 Control Charts for Variables
กรณีที่เปลี่ยนขนาด Sample Size หา Chart Control Charts for Variables