Download
1 / 35
590 likes | 1.16k Views
Erosion and Reservoir sedimentation. Area under different types of Erosion - Soil Degradation. Water Infotech. Total 47.13. The relation of sediment yield to the gross erosion in a water shed is called Sediment Delivery ratio(SDR). Soil Erodability (K). Structure of soil.

E N D
Area under different types of Erosion - Soil Degradation Water Infotech Total 47.13
The relation of sediment yield to the gross erosion in a water shed is called Sediment Delivery ratio(SDR)
Soil Erodability (K) Structure of soil
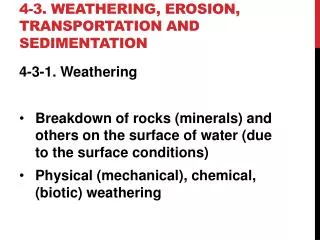
Soil Erodability (K) 1. The material most easily dislodged by runoff has a texture close to that of fine sand. 2. As long as the flow is slow (25 cm/see), it cannot erode. Measures will therefore have to be taken to spread and slow down the flow, in order to prevent linear erosion. 3. Fine clay and loam particles are easily transported, even at low speeds, but in the case of anything coarser than fine sand, it is a short distance from erosion site to sedimentation site
Nomograph allowing a quick assessment of the "K" factor of soil erodibility Procedure: in examining the analysis of appropriate surface samples, enter on the left of the graph and plot the percentage of silt (0.002 to 0.1 mm), then of sand (0.10 to 2 mm), then of organic matter, structure and permeability in the direction indicated by the arrows. Interpolate between the drawn curves if necessary. The broken arrowed line indicates the procedure for a sample having 65% silt + very fine sans, 5% sand, 2.8% organic matter, 2 of structure and 4 of permeability. Erodibility factor K = 0,31.