Download
1 / 33
330 likes | 450 Views
Border Institute IV Binational Water Management Planning Consideration of Opportunities, Costs, Benefits, & Unintended Consequences Rio Rico, Arizona May 6, 7 and 8, 2002. The Challenge of. Balancing Water. Supply & Demand. Charles D. Turner, Ph.D., P.E. UTEP

E N D
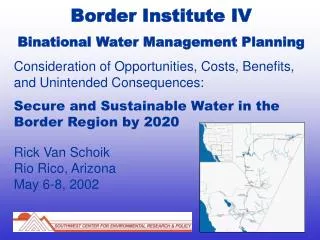
Border Institute IV Binational Water Management Planning Consideration of Opportunities, Costs, Benefits, & Unintended Consequences Rio Rico, Arizona May 6, 7 and 8, 2002
The Challenge of Balancing Water Supply & Demand Charles D. Turner, Ph.D., P.E. UTEP Oscar F. Ibáñez H., M.S. UACJ Ed Hamlyn, AICP UTEP
U.S.-Mexico Border Region 200 km 48 Counties 10 States 96 Municipios
4.0 3.5 3.0 2.5 2.0 1.5 1.0 0.5 0 2000 Population (in millions) San Diego Cd. Juárez Mexicali Lower Rio Grande Valley Tucson Nuevo Laredo
West East Central
Otero Pecos Doña Ana Las Cruces El Paso El Paso Salt Basin Cd. Juárez Hudspeth Ascensión Juárez P.G. Guerrero Rio Grande Río Bravo Guadalupe Elephant Butte Caballo
Jornada del Muerto Tularosa Basin Mesilla Bolson Hueco Bolson Rio Grande Aquifer Conejos Médanos
2,500,000 2,000,000 2,073,000 1,500,000 1,000,000 1944 – Mexican Water Treaty 1954-58 – Drought of Record 1938 – Rio Grande Compact 1906 - Mexican Water Treaty 500,000 1910 1920 1930 1940 1950 1960 1970 2000 1900 1980 1990 El Paso County Juárez Municipio Doña Ana County 43,291 Historical Population Growth
+ 7% + 6% + 5% + 4% + 3% + 2% + 1% 0% - 1% 1900 1910 1920 1930 1940 1950 1960 1970 1980 1990 2000 World Paso del Norte United States México Comparative Growth Rates Average Annual Growth Rate
5,000,000 3,929,000 4,000,000 3,000,000 2,518,000 2,000,000 1,082,000 1,000,000 329,000 2000 2040 2020 1980 1920 1940 1960 1900 7,000,000 Projected Population Growth 6,000,000
1000 900 800 700 600 500 400 300 200 100 0 1980 1976 1972 1974 1982 1984 1986 1988 1992 1994 1996 1998 2000 1978 1990 Per Capita Water Use Trends El Paso 848 606 Per Capita Water Use (liters/person/day) Cd. Juárez 350 1980 2000
Midland Odessa 52o 250 km 128o Albuquerque Phoenix Lubbock Tucson Hermosillo Chihuahua
Irrigated Land (in ha) Surface Water Allocation (in Mm3) Population 1,218,817 36,400 ha 333 Mm3 27,900 ha 174,682 255 Mm3 679,622 74 Mm3 12,100 ha Surface Water Allocation Doña Ana County New Mexico El Paso County Texas Juárez Municipio Chihuahua
Lobatos Santa Fe Albuquerque Albuquerque Elephant Butte Las Cruces El Paso El Paso Cd. Juárez
Perspectives Political Influence Knowledge / Timeframe
Alphabet Soup of Water Management • IBWC/CILA • EPCWID/EBID/009 • USBR • EPA/SEMARNAT • BECC/COCEF • CNA • TNRCC/OSE
Bismark Mines Conejos Médanos S. Río Bravo Aquifer Conejos Médanos N. Río Bravo Surface Water Proposed Water Supply for Cd. Juárez 12 11 10 9 8 7 6 Water Supply (m3/s) 5 4 3 Hueco Bolson 2 1 0 2000 2005 2010 2015 2020
160 200 240 280 320 360 400 440 480 520 560 600 640 680 720 760 Sustainable Population Parameters 10 Surface Water 740 Mm3 Natural Recharge 30 Mm3 8 No Agriculture, 50% Recycling No Agriculture, No Recycling 50% Agriculture, No Recycling 6 Population (in millions) 4 2 0 320 Per Capita Water Use (liters per person per day)
Sovereignty Precludes this Option! Scenarios for Cooperative Planning • Individual actions based on parochial interests • Guarded dialogue and limited cooperation • Forthright information-sharing & willingness to engage in projects of mutual benefit • An International Water Management District
Tools for Possible Solutions • Technology • Water Markets • Region-based Cooperation • Conservation • Growth Management • Financial Capability