Download
1 / 1
10 likes | 109 Views
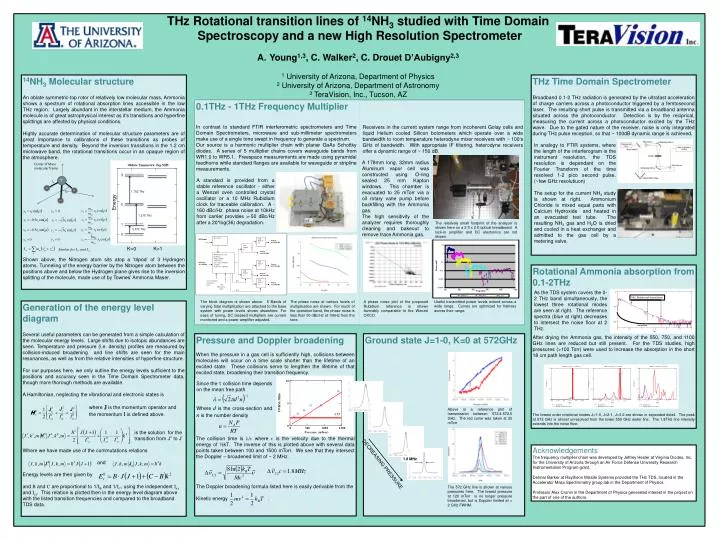
Center of Mass molecular frame. N 14. r 0. H. H. a. H. THz Rotational transition lines of 14 NH 3 studied with Time Domain Spectroscopy and a new High Resolution Spectrometer Young 1,3 , C. Walker 2 , C. Drouet D’Aubigny 2,3 1 University of Arizona, Department of Physics

E N D
Center of Mass molecular frame N14 r0 H H a H • THz Rotational transition lines of 14NH3 studied with Time Domain • Spectroscopy and a new High Resolution Spectrometer • Young1,3, C. Walker2, C. Drouet D’Aubigny2,3 • 1 University of Arizona, Department of Physics • 2 University of Arizona, Department of Astronomy • 3TeraVision, Inc., Tucson, AZ 14NH3 Molecular structure An oblate symmetric-top rotor of relatively low molecular mass, Ammonia shows a spectrum of rotational absorption lines accessible in the low THz region. Largely abundant in the interstellar medium, the Ammonia molecule is of great astrophysical interest as it’s transitions and hyperfine splittings are affected by physical conditions. Highly accurate determination of molecular structure parameters are of great importance to calibrations of these transitions as probes of temperature and density. Beyond the inversion transitions in the 1.2 cm microwave band, the rotational transitions occur in an opaque region of the atmosphere. Shown above, the Nitrogen atom sits atop a ‘tripod’ of 3 Hydrogen atoms. Tunneling of the energy barrier by the Nitrogen atom between the positions above and below the Hydrogen plane gives rise to the inversion splitting of the molecule, made use of by Townes’ Ammonia Maser. THz Time Domain Spectrometer Broadband 0.1-2 THz radiation is generated by the ultrafast acceleration of charge carriers across a photoconductor triggered by a femtosecond laser. The resulting short pulse is transmitted via a broadband antenna situated across the photoconductor. Detection is by the reciprical, measuring the current across a photoconductor excited by the THz wave. Due to the gated nature of the receiver, noise is only integrated during THz pulse reception, so that ~ 100dB dynamic range is achieved. 0.1THz - 1THz Frequency Multiplier In contrast to standard FTIR interferometric spectrometers and Time Domain Spectrometers, microwave and sub-millimeter spectrometers make use of a single tone swept in frequency to generate a spectrum. Our source is a harmonic multiplier chain with planar GaAsSchottky diodes. A series of 5 multiplier chains covers waveguide bands from WR1.0 to WR5.1. Freespace measurements are made using pyramidal feedhorns while standard flanges are available for waveguide or stripline measurements. Receivers in the current system range from incoherent Golay cells and liquid Helium cooled Silicon bolometers which operate over a wide bandwidth to room temperature heterodyne mixer receivers with ~ 100’s GHz of bandwidth. With appropriate IF filtering, heterodyne receivers offer a dynamic range of ~ 150 dB. Power Box VDI WR1.0 x3 AC Power Output: 600-900GHz VDI WR3.4 x3 Output: 220-325GHz WR10 Base System Including Marki A2050, a WR9.3x3, and a Spacek WR10 amplifier Output: 65-120 GHz VDI WR1.5 x3 RF Input: 21.6-40GHz In analogy to FTIR systems, where the length of the interferogram is the instrument resolution, the TDS resolution is dependant on the Fourier Transform of the time resolved 1-2 pico second pulse. (~few GHz resolutiuon) The setup for the current NH3 study is shown at right. Ammonium Chloride is mixed equal parts with Calcium Hydroxide and heated in an evacuated test tube. The resulting NH3 gas and H2O is dried and cooled in a heat exchanger and admitted to the gas cell by a metering valve. Output: 450-700GHz VDI WR5.1 x2 Output: 140-225GHz VDI WR2.2 x2 User-Controlled Attenuation Input TTL Modulation Input A 178mm long, 32mm radius Aluminum vapor cell was constructed using O-ring sealed 25 mm Kapton windows. This chamber is evacuated to 25 mTorr via a oil rotary vane pump before backfilling with the Ammonia gas. The high sensitivity of the analyzer requires thoroughly cleaning and bakeout to remove trace Ammonia gas. Bias Output: 325-460GHz Bias 3 A standard is provided from a stable reference oscillator - either a Wenzel oven controlled crystal oscillator or a 10 MHz Rubidium clock for traceable calibration. A -160 dBc/Hz phase noise at 10kHz from carrier provides >-50 dBc/Hz after a 20*log(36) degradation. 1.762 THz Energy 2 1.215 THz The relatively small footprint of the analyzer is shown here on a 2 ft x 2 ft optical breadboard. A lock-in amplifier and DC electronics are not shown. 1 0.572 THz 0 K=0 K=1 Similar for Iyy and Izz Rotational Ammonia absorption from 0.1-2THz After drying the Ammonia gas, the intensity of the 550, 750, and 1100 GHz lines are reduced but still present. For the TDS studies, high pressures (>100 Torr) were used to increase the absorption in the short 18 cm path length gas cell. The lowest order rotational modes J=1-0, J=2-1, J=3-2 are shown in expanded detail. The peak at 572 GHz is almost unresolved from the lower 550 GHz water line. The 1.8THz line intensity extends into the noise floor. As the TDS system covers the 0-2 THz band simultaneously, the lowest three rotational modes are seen at right. The reference spectra (blue at right) decreases to intersect the noise floor at 2 THz. Useful transmitted power levels extend across a wide range. Curves are optimized for flatness across their range. The block diagram is shown above. 5 Bands of varying total multiplication are attached to the base system with power levels shown elsewhere. For ease of tuning, DC biaesed multipliers are current monitored and a power amplifier adjusted. The phase noise at various levels of multiplication are shown. For much of the operation band, the phase noise is less than 50 dBc/Hz at 10kHz from the tone. A phase noise plot of the proposed Rubidium reference is shown favorably comparable to the Wenzel OXCO. Generation of the energy level diagram Several useful parameters can be generated from a simple calculation of the molecular energy levels. Large shifts due to isotopic abundances are seen. Temperature and pressure (i.e. density) profiles are measured by collision-induced broadening and line shifts are seen for the main resonances, as well as from the relative intensities of hyperfine structure. For our purposes here, we only outline the energy levels sufficient to the positions and accuracy seen in the Time Domain Spectrometer data, though more thorough methods are available. A Hamiltonian, neglecting the vibrational and electronic states is where J is the momentum operator and the momentum I is defined above. is the solution for the transition from J’’ to J’ Where we have made use of the commutations relations and Energy levels are then given by and B and C are proportional to 1/IB and 1/IC, using the independent Ixx and Izz. This relation is plotted then in the energy level diagram above with the listed transition frequencies and compared to the broadband TDS data. NH3 Rotational transitions Noise floor Pressure and Doppler broadening When the pressure in a gas cell is sufficiently high, collisions between molecules will occur on a time scale shorter than the lifetime of an excited state. These collisions serve to lengthen the lifetime of that excited state, broadening their transition frequency. The collision time is l/v where v is the velocity due to the thermal energy of ½kT. The inverse of this is plotted above with several data points taken between 100 and 1500 mTorr. We see that they intersect the Doppler – broadened limit of ~ 2 MHz. The Doppler broadening formula listed here is easily derivable from the Kinetic energy . Ground state J=1-0, K=0 at 572GHz Since the t collision time depends on the mean free path Where d is the cross-section and n is the number density Above is a reference plot of transmission between 572.4-572.5 GHz. The red curve was taken at 25 mTorr Acknowledgements The frequency multiplier chain was developed by Jeffrey Hesler at Virginia Diodes, Inc. for the University of Arizona through an Air Force Defense University Research Instrumentation Program grant. Delmar Barker at Raytheon Missile Systems provided the THz TDS, located in the Accelerator Mass Spectrometry group lab in the Department of Physics. Professor Alex Cronin in the Department of Physics generated interest in the project on the part of one of the authors. 1.8 MHz DECREASING PRESSURE The 572 GHz line is shown at various pressures here. The lowest pressure at 120 mTorr is no longer pressure broadened, but is Doppler limited at < 2 GHz FWHM.