Download
1 / 5
50 likes | 161 Views
Supplementary Figure 1. A. B. U2OS. EZH2siRNA. Cntl siRNA. p=0.002. p<0.001. p=0.017. Cell viability (relative units). MCF7. p=0.025. EZH2siRNA. Cntl siRNA.

E N D
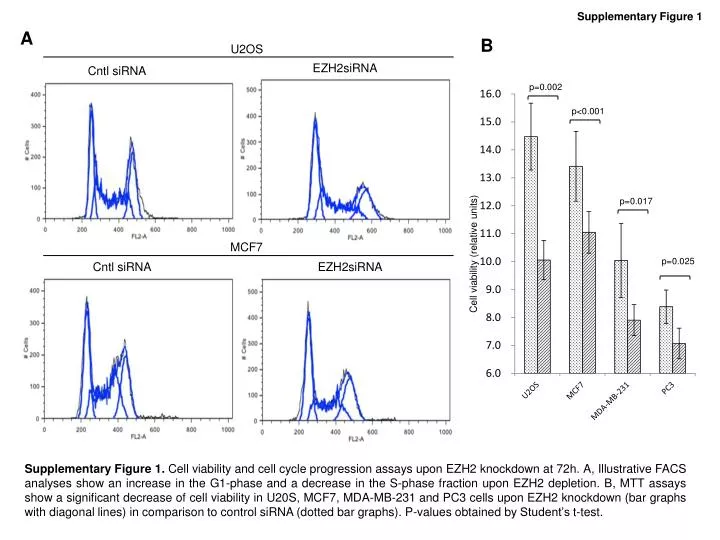
Supplementary Figure 1 A B U2OS EZH2siRNA Cntl siRNA p=0.002 p<0.001 p=0.017 Cell viability (relative units) MCF7 p=0.025 EZH2siRNA Cntl siRNA Supplementary Figure 1. Cell viability and cell cycle progression assays upon EZH2 knockdown at 72h. A, Illustrative FACS analyses show an increase in the G1-phase and a decrease in the S-phase fraction upon EZH2 depletion. B, MTT assays show a significant decrease of cell viability in U20S, MCF7, MDA-MB-231 and PC3 cells upon EZH2 knockdown (bar graphs with diagonal lines) in comparison to control siRNA (dotted bar graphs). P-values obtained by Student’s t-test.
Supplementary Figure 2 P <0.001 P <0.001 P < 0.01 P <0.001 Supplementary Figure 2. Establishment of a U2OS cell line stably transfected with a short-hairpin RNA (shRNA) against EZH2 that shows depletion of EZH2 and enhancement of KLF2 expression determined by qRT-PCR.
Supplementary Figure 3 P < 0.001 P = 0.002 P = 0.001 P = 0.001 P = 0.003 P = 0.046 P < 0.001 P = 0.033 P = 0.001 P = 0.004 P = 0.046 P = 0.027 P = 0.003 P = 0.488 P = 0.022 Supplementary Figure 3. qChIP data forthe well-known EZH2-target gene ADRB2 (Yu et al., 2007). EZH2 RNAi experiments reduced EZH2 occupancy and 3meH3K27 presence and induced the recruitment of RNAP-S2 for the ADRB2 promoter.
Supplementary Figure 4 Supplementary Figure 4. Bisulfite genomic sequencing of multiple clones shows that the 5’-CpG island of the KLF2 gene is unmethylated in the used cell lines. White squares, unmethylated CpGs; black squares, methylated CpGs. TSS, transcription start site.
Supplementary Figure 5 P<0.001 P<0.001 Supplementary Figure 5. U2OS cells transfected with EZH2 siRNA, KLF2 siRNA, both siRNAs or scramble RNAi (left). The MTT assays demonstrate that if EZH2 depleted cells had an impairment in growth in comparison to scramble-control cells, the simultaneous depletion of KLF2 in these cells is able to “rescue” the tumorigenic phenotype (right).